
Texas Rangers at Tampa Bay Rays
· Major League Baseball
0 - 3

Diaz, Vilade homers and a 4-hitter in a bullpen game helps Rays beat Rangers 3-0

Ian Seymour (7-3) allowed just two hits in 4 2/3 innings of bulk relief behind opener Casey Legumina, who allowed one hit in 1 2/3 innings. Garret Cleavinger pitched out of a seventh-inning jam, and Kevin Kelly struck out the side in the eighth.
Bryan Baker converted his 19th consecutive save and 29th overall with a scoreless final inning to close out the ninth shutout this season for AL East-leading Tampa Bay. It was the Rays' third shutout in four games.
Texas starter MacKenzie Gore (6-9) allowed three hits and struck out nine in seven innings, retiring 20 of the final 21 batters he faced. The Rangers held the Rays without a hit for the final 7 2/3 innings.
Tampa Bay jumped on Gore in the first inning as Diaz led off with a 372-foot, opposite-field shot to right. Jonathan Aranda followed with a double before Vilade hit a two-run homer with one out that struck the “D” Ring in left field.
Seymour allowed a one-out double in the third before retiring 10 consecutive batters.
Texas put runners on first and second with one out in the seventh after a double by Jake Burger and walk to Nicky Lopez. But Cleavinger struck out Cam Cauley before Alejandro Osuna bounced out in front of the plate to end the threat.
How can I watch Texas Rangers vs. Tampa Bay Rays?
- TV Channel: Rangers at Rays 2022 MLB Baseball, is broadcasted on MLB.TV.
- Online streaming: Sign up for Fubo.
Scoring Summary
 |
9th Inning | Lopez lined out to third. |
|
9th Inning | Burger flied out to center. |
|
9th Inning | Nimmo doubled to center. |
|
9th Inning | Duran grounded out to third. |
 |
9th Inning | Baker relieved Kelly |
|
8th Inning | Aranda grounded out to second. |
Statistics
 TEX |
 TB |
|
|---|---|---|
| 1 | Games Played | 1 |
| 1 | Team Games Played | 1 |
| 0 | Hit By Pitch | 1 |
| 8 | Ground Balls | 7 |
| 8 | Strikeouts | 9 |
| 0 | Runs Batted In | 3 |
| 0 | Sacrifice Hit | 0 |
| 4 | Hits | 3 |
| 0 | Stolen Bases | 0 |
| 1 | Walks | 1 |
| 0 | Catcher Interference | 0 |
| 0 | Runs | 3 |
| 0 | Ground Into Double Play | 0 |
| 0 | Sacrifice Flies | 0 |
| 31 | At Bats | 27 |
| 0 | Home Runs | 2 |
| 0 | Grand Slam Home Runs | 0 |
| 9 | Runners Left On Base | 5 |
| 0 | Triples | 0 |
| 0 | Game Winning RBIs | 1 |
| 0 | Intentional Walks | 0 |
| 4 | Doubles | 1 |
| 15 | Fly Balls | 11 |
| 0 | Caught Stealing | 0 |
| 135 | Pitches | 114 |
| 0 | Games Started | 0 |
| 2 | Pinch At Bats | 0 |
| 0 | Pinch Hits | 0 |
| 0.0 | Player Rating | 0.0 |
| 1 | Is Qualified | 1 |
| 0 | Is Qualified In Steals | 0 |
| 8 | Total Bases | 10 |
| 32 | Plate Appearances | 29 |
| 0.0 | Projected Home Runs | 324.0 |
| 4 | Extra Base Hits | 3 |
| 0.7 | Runs Created | 1.7 |
| .129 | Batting Average | .111 |
| .000 | Pinch Hit Average | .000 |
| .258 | Slugging Percentage | .370 |
| .161 | Secondary Average | .296 |
| .156 | On Base Percentage | .172 |
| .414 | OBP Pct + SLG Pct | .543 |
| 0.5 | Ground To Fly Ball Ratio | 0.6 |
| 0.7 | Runs Created Per 27 Outs | 1.9 |
| 12.0 | Batter Rating | 23.0 |
| 0.0 | At Bats Per Home Run | 13.5 |
| 0.00 | Stolen Base Percentage | 0.00 |
| 4.22 | Pitches Per Plate Appearance | 3.93 |
| .129 | Isolated Power | .259 |
| 0.13 | Walk To Strikeout Ratio | 0.11 |
| .031 | Walks Per Plate Appearance | .034 |
| .032 | Secondary Average Minus Batting Average | .185 |
| 0.0 | Runs Produced | 6.0 |
| 0.0 | Runs Ratio | 1.0 |
| 0.3 | Patience Ratio | 0.4 |
| 0.2 | Balls In Play Average | 0.1 |
| 62.5 | MLB Rating | 70.3 |
| 0.0 | Offensive Wins Above Replacement | 0.0 |
| 0.0 | Wins Above Replacement | 0.0 |
Game Information
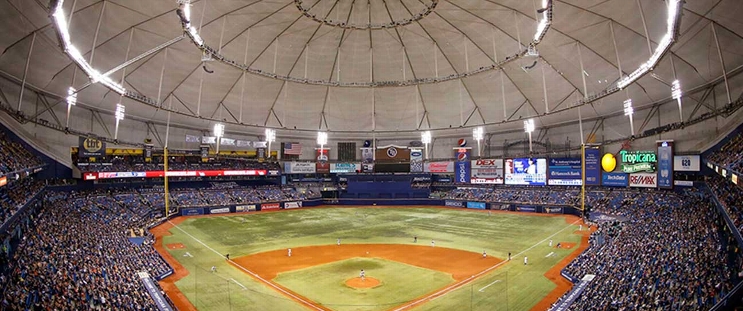
Location: St. Petersburg, Florida
Attendance: 14,200 | Capacity:
2026 American League West Standings
| TEAM | W | L | PCT | GB | STRK |
|---|---|---|---|---|---|
 Houston |
- | 81 | W2 | 0.5 | 81 |
| Texas |
1 | 82 | L1 | 0.49382716 | 80 |
 Seattle |
5 | 86 | W2 | 0.4691358 | 76 |
 Athletics |
17 | 98 | L2 | 0.39506173 | 64 |
 Los Angeles |
19 | 100 | L2 | 0.38271606 | 62 |
2026 American League East Standings
| TEAM | W | L | PCT | GB | STRK |
|---|---|---|---|---|---|
| Tampa Bay |
- | 64 | L1 | 0.60493827 | 98 |
 New York |
4.5 | 68 | W1 | 0.57763976 | 93 |
 Boston |
11 | 75 | L1 | 0.537037 | 87 |
 Baltimore |
18.5 | 82 | L1 | 0.49068323 | 79 |
 Toronto |
19 | 83 | W1 | 0.48765433 | 79 |