
Philadelphia Phillies at Minnesota Twins
· Major League Baseball
9 - 1

Alec Bohm has 5 hits in the Phillies' 9-1 victory over the Twins

Bohm doubled in the second, fourth and ninth innings and singled in the fifth and seventh for his first career five-hit game.
Bryce Harper had two hits and Bryson Stott homered for the Phillies.
Luzardo (11-5) struck out nine and walked two while allowing just one run to continue his outstanding season. The first-time All-Star has allowed two or fewer earned runs in 15 of his last 17 starts dating to late April.
Connor Prielipp (4-5) allowed eight runs on eight hits while walking four and striking out six over five innings.
Ryan Jeffers and Royce Lewis doubled in the sixth for the Twins' only run.
The Phillies loaded the bases with nobody out in the second, but Prielipp held them to one run on J.T. Realmuto's sacrifice fly.
An overturned call kept the Twins off the board in the fourth. Luke Keaschall reached on a two-out single, then attempted to score on Brooks Lee's single to center. He appeared to slide in just ahead of Luis Arráez's relay throw, but the Phillies successfully challenged the call.
Philadelphia broke it open in the fifth with seven runs, all scored with two outs. Realmuto led off with a single, but Prielipp quickly retired the next two hitters. He then walked three straight batters to force in a run, making it 2-0.
Bohm singled home a run and Edmundo Sosa's base hit plated two more. Then Stott capped the inning with the big blow, a three-run homer off the right field foul pole to give Philadelphia an 8-0 lead.
Phillies shortstop Trea Turner fouled a ball off his right knee and left the game in the eighth inning.
See AP’s full MLB coverage here
How can I watch Philadelphia Phillies vs. Minnesota Twins?
- TV Channel: Phillies at Twins 2022 MLB Baseball, is broadcasted on MLB.TV.
- Online streaming: Sign up for Fubo.
Scoring Summary
 |
9th Inning | Jeffers flied out to right. |
|
9th Inning | Buxton walked, Culpepper to second. |
|
9th Inning | Martin struck out looking. |
|
9th Inning | Culpepper singled to left. |
|
9th Inning | Kreidler struck out swinging. |
 |
9th Inning | Shugart relieved McFarlane |
Statistics
 PHI |
 MIN |
|
|---|---|---|
| 1 | Games Played | 1 |
| 1 | Team Games Played | 1 |
| 0 | Hit By Pitch | 0 |
| 10 | Ground Balls | 4 |
| 8 | Strikeouts | 14 |
| 9 | Runs Batted In | 1 |
| 0 | Sacrifice Hit | 0 |
| 13 | Hits | 9 |
| 0 | Stolen Bases | 0 |
| 6 | Walks | 4 |
| 0 | Catcher Interference | 0 |
| 9 | Runs | 1 |
| 0 | Ground Into Double Play | 0 |
| 2 | Sacrifice Flies | 0 |
| 37 | At Bats | 35 |
| 1 | Home Runs | 0 |
| 0 | Grand Slam Home Runs | 0 |
| 22 | Runners Left On Base | 22 |
| 0 | Triples | 0 |
| 1 | Game Winning RBIs | 0 |
| 0 | Intentional Walks | 0 |
| 3 | Doubles | 5 |
| 21 | Fly Balls | 17 |
| 0 | Caught Stealing | 0 |
| 162 | Pitches | 149 |
| 0 | Games Started | 0 |
| 1 | Pinch At Bats | 0 |
| 0 | Pinch Hits | 0 |
| 0.0 | Player Rating | 0.0 |
| 1 | Is Qualified | 1 |
| 0 | Is Qualified In Steals | 0 |
| 19 | Total Bases | 14 |
| 45 | Plate Appearances | 39 |
| 162.0 | Projected Home Runs | 0.0 |
| 4 | Extra Base Hits | 5 |
| 8.5 | Runs Created | 4.9 |
| .351 | Batting Average | .257 |
| .000 | Pinch Hit Average | .000 |
| .514 | Slugging Percentage | .400 |
| .324 | Secondary Average | .257 |
| .422 | On Base Percentage | .333 |
| .936 | OBP Pct + SLG Pct | .733 |
| 0.5 | Ground To Fly Ball Ratio | 0.2 |
| 8.9 | Runs Created Per 27 Outs | 5.1 |
| 58.0 | Batter Rating | 23.0 |
| 37.0 | At Bats Per Home Run | 0.0 |
| 0.00 | Stolen Base Percentage | 0.00 |
| 3.60 | Pitches Per Plate Appearance | 3.82 |
| .162 | Isolated Power | .143 |
| 0.75 | Walk To Strikeout Ratio | 0.29 |
| .133 | Walks Per Plate Appearance | .103 |
| -.027 | Secondary Average Minus Batting Average | .000 |
| 18.0 | Runs Produced | 2.0 |
| 1.0 | Runs Ratio | 1.0 |
| 0.6 | Patience Ratio | 0.5 |
| 0.4 | Balls In Play Average | 0.4 |
| 103.0 | MLB Rating | 75.0 |
| 0.0 | Offensive Wins Above Replacement | 0.0 |
| 0.0 | Wins Above Replacement | 0.0 |
Game Information
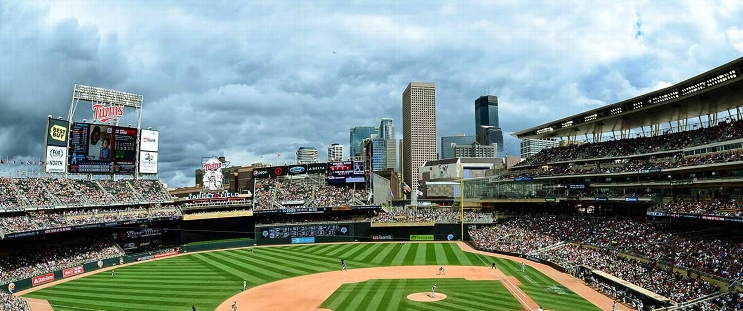
Location: Minneapolis, Minnesota
Attendance: 29,218 | Capacity:
2026 National League East Standings
| TEAM | W | L | PCT | GB | STRK |
|---|---|---|---|---|---|
 Atlanta |
- | 68 | L1 | 0.5802469 | 94 |
| Philadelphia |
6 | 74 | W1 | 0.54320985 | 88 |
 Miami |
14 | 82 | W1 | 0.49382716 | 80 |
 Washington |
17 | 85 | W1 | 0.47530866 | 77 |
 New York |
20 | 88 | L1 | 0.45679012 | 74 |
2026 American League Central Standings
| TEAM | W | L | PCT | GB | STRK |
|---|---|---|---|---|---|
 Cleveland |
- | 77 | L1 | 0.52469134 | 85 |
 Chicago |
1 | 78 | W1 | 0.5185185 | 84 |
| Minnesota |
8 | 85 | W1 | 0.47530866 | 77 |
 Detroit |
9 | 86 | L1 | 0.4691358 | 76 |
 Kansas City |
16 | 93 | W1 | 0.42592594 | 69 |