
Arizona Diamondbacks at Boston Red Sox
· Major League Baseball
1 - 11

Red Sox overwhelm Diamondbacks 11-1 as all 9 starters drive in a run

Boston, which scored in six straight innings, did not have a strikeout in the game and finished with 16 hits to maintain a six-game lead for the second AL wild card.
Brayan Bello (5-6) worked 4 2/3 innings of relief, striking out three and allowing a run on three hits. Bello has a 0.85 ERA in 11 relief appearances (52 2/3 innings) this season.
Wyatt Olds made his major league debut for Boston and got his first career strikeout.
Boston jumped to a 4-0 lead after four innings as Eli White and Caleb Durbin drove in runs with singles, while Nick Sogard and Ceddanne Rafaela added RBI doubles.
Boston stretched its lead to 7-0 in the fifth on Contreras’ 342-foot homer, Andruw Monasterio’s sacrifice fly and Gasper’s RBI groundout.
Arizona got on the board with Geraldo Perdomo’s sacrifice fly in the sixth.
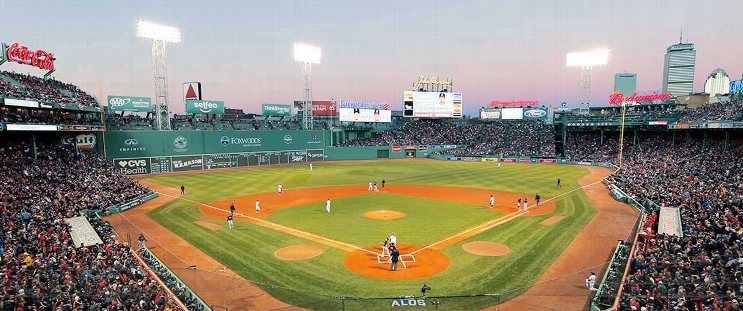
Wilyer Abreu and Adley Rutschman answered with RBI hits before Gasper’s first Red Sox homer sneaked around Pesky's Pole in the seventh and Abreu hit an RBI single.
Mitch Bratt (1-2) pitched three innings of three-run ball for Arizona. Zack Littell gave up the final eight runs on 11 hits without a strikeout.
See AP’s full MLB coverage here
How can I watch Arizona Diamondbacks vs. Boston Red Sox?
- TV Channel: Diamondbacks at Red Sox 2022 MLB Baseball, is broadcasted on MLB.TV.
- Online streaming: Sign up for Fubo.
Scoring Summary
 |
9th Inning | Tawa grounded out to third. |
|
9th Inning | Lawlar struck out swinging. |
|
9th Inning | McCann struck out swinging. |
 |
9th Inning | Olds relieved Morán |
|
8th Inning | Gasper lined out to center. |
|
8th Inning | Monasterio flied out to center. |
Statistics
 ARI |
 BOS |
|
|---|---|---|
| 1 | Games Played | 1 |
| 1 | Team Games Played | 1 |
| 1 | Hit By Pitch | 0 |
| 13 | Ground Balls | 7 |
| 8 | Strikeouts | 0 |
| 1 | Runs Batted In | 11 |
| 0 | Sacrifice Hit | 0 |
| 4 | Hits | 16 |
| 0 | Stolen Bases | 1 |
| 1 | Walks | 3 |
| 0 | Catcher Interference | 0 |
| 1 | Runs | 11 |
| 0 | Ground Into Double Play | 0 |
| 1 | Sacrifice Flies | 1 |
| 30 | At Bats | 40 |
| 0 | Home Runs | 2 |
| 0 | Grand Slam Home Runs | 0 |
| 8 | Runners Left On Base | 15 |
| 0 | Triples | 0 |
| 0 | Game Winning RBIs | 1 |
| 0 | Intentional Walks | 0 |
| 1 | Doubles | 7 |
| 10 | Fly Balls | 34 |
| 0 | Caught Stealing | 0 |
| 128 | Pitches | 162 |
| 0 | Games Started | 0 |
| 1 | Pinch At Bats | 0 |
| 0 | Pinch Hits | 0 |
| 0.0 | Player Rating | 0.0 |
| 1 | Is Qualified | 1 |
| 0 | Is Qualified In Steals | 1 |
| 5 | Total Bases | 29 |
| 33 | Plate Appearances | 44 |
| 0.0 | Projected Home Runs | 324.0 |
| 1 | Extra Base Hits | 9 |
| 0.4 | Runs Created | 11.7 |
| .133 | Batting Average | .400 |
| .000 | Pinch Hit Average | .000 |
| .167 | Slugging Percentage | .725 |
| .067 | Secondary Average | .425 |
| .182 | On Base Percentage | .432 |
| .348 | OBP Pct + SLG Pct | 1.157 |
| 1.3 | Ground To Fly Ball Ratio | 0.2 |
| 0.4 | Runs Created Per 27 Outs | 12.6 |
| 10.0 | Batter Rating | 81.0 |
| 0.0 | At Bats Per Home Run | 20.0 |
| 0.00 | Stolen Base Percentage | 1.00 |
| 3.88 | Pitches Per Plate Appearance | 3.68 |
| .033 | Isolated Power | .325 |
| 0.13 | Walk To Strikeout Ratio | 0.00 |
| .030 | Walks Per Plate Appearance | .068 |
| -.067 | Secondary Average Minus Batting Average | .025 |
| 2.0 | Runs Produced | 22.0 |
| 1.0 | Runs Ratio | 1.0 |
| 0.2 | Patience Ratio | 0.8 |
| 0.2 | Balls In Play Average | 0.4 |
| 62.3 | MLB Rating | 121.3 |
| 0.0 | Offensive Wins Above Replacement | 0.0 |
| 0.0 | Wins Above Replacement | 0.0 |
Game Information
Location: Boston, Massachusetts
Attendance: 36,511 | Capacity:
2026 National League West Standings
| TEAM | W | L | PCT | GB | STRK |
|---|---|---|---|---|---|
 Los Angeles |
- | 62 | W3 | 0.61728394 | 100 |
 San Diego |
9 | 71 | W2 | 0.5617284 | 91 |
| Arizona |
14 | 76 | L2 | 0.5308642 | 86 |
 San Francisco |
35 | 97 | L5 | 0.40123457 | 65 |
 Colorado |
42 | 104 | L1 | 0.3580247 | 58 |
2026 American League East Standings
| TEAM | W | L | PCT | GB | STRK |
|---|---|---|---|---|---|
 Tampa Bay |
- | 64 | L1 | 0.60493827 | 98 |
 New York |
4.5 | 68 | W1 | 0.57763976 | 93 |
| Boston |
11 | 75 | L1 | 0.537037 | 87 |
 Baltimore |
18.5 | 82 | L1 | 0.49068323 | 79 |
 Toronto |
19 | 83 | W1 | 0.48765433 | 79 |