
San Francisco Giants at Boston Red Sox
· Major League Baseball
4 - 6

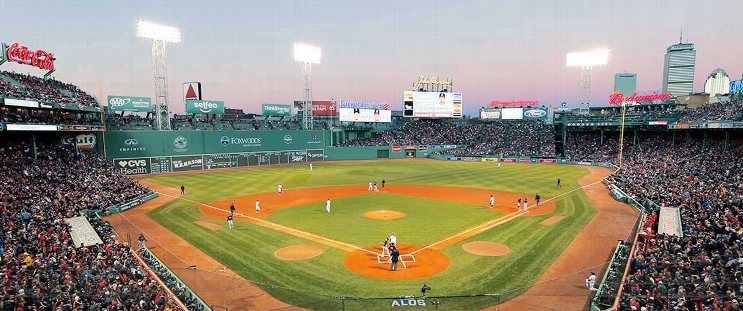
Willson Contreras hits 3-run homer, Red Sox outlast Giants 6-4 in Rafael Devers' return to Fenway

The Giants pulled within 5-4 in the fourth inning after Drew Gilbert hit a two-run homer off Boston starter Sonny Gray, and Devers followed with a solo homer, his 26th this season.
But Wilyer Abreu’s RBI triple in the sixth gave Boston enough cushion. Gray (16-3) pitched six innings, allowing four runs off seven hits and while striking out six. Aroldis Chapman struck out three and walked one in the ninth to pick up his 28th save.
Bryce Eldridge added an RBI single for San Francisco.
Contreras jumped on an 85-mph changeup from Giants starter Logan Webb (8-8) and crushed a 450-foot rope over the Green Monster and out of stadium for his 26th homer to put the Red Sox in front 3-1.
It was part of a five-run inning for Boston. Webb walked Andruw Monasterio with the bases loaded and then hit Mickey Gasper to let in another run before being pulled.
Friday marked Devers’ first time back at Fenway Park since a refusal to play first base contributed to the three-time All-Star being traded to San Francisco 14 months ago.
Devers received a mix of cheers and boos when he was introduced. The boos were more prominent when he came up to bat. Then, when Gray struck him out, the home crowd erupted in applause.
But Boston fans also cheered for Devers between the first and second innings after a highlight video of him was played on the video screen. Devers was shown on camera applauding and waving.
See AP’s full MLB coverage here
How can I watch San Francisco Giants vs. Boston Red Sox?
- TV Channel: Giants at Red Sox 2022 MLB Baseball, is broadcasted on MLB.TV.
- Online streaming: Sign up for Fubo.
Scoring Summary
 |
9th Inning | Cox struck out swinging. |
|
9th Inning | Koss struck out swinging. |
|
9th Inning | Kennedy walked. |
|
9th Inning | Kennedy hit for Cavanaugh |
|
9th Inning | Bericoto struck out swinging. |
 |
9th Inning | Chapman relieved Gamboa |
Statistics
 SF |
 BOS |
|
|---|---|---|
| 1 | Games Played | 1 |
| 1 | Team Games Played | 1 |
| 0 | Hit By Pitch | 2 |
| 11 | Ground Balls | 18 |
| 12 | Strikeouts | 3 |
| 4 | Runs Batted In | 6 |
| 0 | Sacrifice Hit | 0 |
| 7 | Hits | 11 |
| 0 | Stolen Bases | 0 |
| 3 | Walks | 5 |
| 0 | Catcher Interference | 0 |
| 4 | Runs | 6 |
| 0 | Ground Into Double Play | 2 |
| 0 | Sacrifice Flies | 0 |
| 34 | At Bats | 32 |
| 2 | Home Runs | 1 |
| 0 | Grand Slam Home Runs | 0 |
| 12 | Runners Left On Base | 13 |
| 0 | Triples | 2 |
| 0 | Game Winning RBIs | 1 |
| 0 | Intentional Walks | 0 |
| 2 | Doubles | 0 |
| 11 | Fly Balls | 11 |
| 0 | Caught Stealing | 1 |
| 141 | Pitches | 156 |
| 0 | Games Started | 0 |
| 2 | Pinch At Bats | 0 |
| 0 | Pinch Hits | 0 |
| 0.0 | Player Rating | 0.0 |
| 1 | Is Qualified | 1 |
| 0 | Is Qualified In Steals | 1 |
| 15 | Total Bases | 18 |
| 37 | Plate Appearances | 39 |
| 324.0 | Projected Home Runs | 162.0 |
| 4 | Extra Base Hits | 3 |
| 4.2 | Runs Created | 7.2 |
| .206 | Batting Average | .344 |
| .000 | Pinch Hit Average | .000 |
| .441 | Slugging Percentage | .563 |
| .324 | Secondary Average | .344 |
| .270 | On Base Percentage | .462 |
| .711 | OBP Pct + SLG Pct | 1.024 |
| 1.0 | Ground To Fly Ball Ratio | 1.6 |
| 4.2 | Runs Created Per 27 Outs | 8.1 |
| 33.0 | Batter Rating | 43.0 |
| 17.0 | At Bats Per Home Run | 32.0 |
| 0.00 | Stolen Base Percentage | 0.00 |
| 3.81 | Pitches Per Plate Appearance | 4.00 |
| .235 | Isolated Power | .219 |
| 0.25 | Walk To Strikeout Ratio | 1.67 |
| .081 | Walks Per Plate Appearance | .128 |
| .118 | Secondary Average Minus Batting Average | .000 |
| 8.0 | Runs Produced | 12.0 |
| 1.0 | Runs Ratio | 1.0 |
| 0.5 | Patience Ratio | 0.7 |
| 0.3 | Balls In Play Average | 0.4 |
| 80.0 | MLB Rating | 95.5 |
| 0.0 | Offensive Wins Above Replacement | 0.0 |
| 0.0 | Wins Above Replacement | 0.0 |
Game Information
Location: Boston, Massachusetts
Attendance: 37,007 | Capacity:
2026 National League West Standings
| TEAM | W | L | PCT | GB | STRK |
|---|---|---|---|---|---|
 Los Angeles |
- | 62 | W3 | 0.61728394 | 100 |
 San Diego |
9 | 71 | W2 | 0.5617284 | 91 |
 Arizona |
14 | 76 | L2 | 0.5308642 | 86 |
| San Francisco |
35 | 97 | L5 | 0.40123457 | 65 |
 Colorado |
42 | 104 | L1 | 0.3580247 | 58 |
2026 American League East Standings
| TEAM | W | L | PCT | GB | STRK |
|---|---|---|---|---|---|
 Tampa Bay |
- | 64 | L1 | 0.60493827 | 98 |
 New York |
4.5 | 68 | W1 | 0.57763976 | 93 |
| Boston |
11 | 75 | L1 | 0.537037 | 87 |
 Baltimore |
18.5 | 82 | L1 | 0.49068323 | 79 |
 Toronto |
19 | 83 | W1 | 0.48765433 | 79 |