
Cincinnati Reds at Arizona Diamondbacks
· Major League Baseball
3 - 5

Ildemaro Vargas' 2-run triple highlights rally that pushes the Diamondbacks past Reds 5-3

The D-backs remain two games behind the San Diego Padres for the final NL wild-card spot.
Trailing 3-1 in the seventh, Arizona loaded the bases with no outs against starter Andrew Abbott. Lars Nootbaar made it 3-2 with a fielder's choice off reliever Luis Mey and then Vargas followed with his two-run triple that rolled all the way to the right-center field wall.
Corbin Carroll's sacrifice fly brought home Vargas and made it 5-3.
Kevin Ginkel struck out Tyler Stephenson looking to end the game, stranding runners on first and second. It was his second save of the year.
It was a tough ending for Abbott (6-9), who pitched well through the first six innings. He gave up four runs and seven hits and two walks, striking out six.
The Reds jumped to a 3-0 lead in the third on Sal Stewart's RBI single and Eugenio Suarez's two-run single. Elly De La Cruz started the inning with a leadoff double into the left-field corner.
The D-backs cut the deficit to 3-1 in the sixth on Gabriel Moreno's sacrifice fly that brought home Carroll, who reached on a triple. His 16 triples this season are the most in the big leagues and his 59 career triples are the most among active MLB players.
Arizona left-hander Mitch Bratt lasted just three innings for a second straight outing. The rookie gave up three runs and five hits and three walks while striking out three.
See AP’s full MLB coverage here
How can I watch Cincinnati Reds vs. Arizona Diamondbacks?
- TV Channel: Reds at Diamondbacks 2022 MLB Baseball, is broadcasted on Peacock.
- Online streaming: Sign up for Fubo.
Scoring Summary
 |
9th Inning | Stephenson struck out looking. |
|
9th Inning | Myers safe at first on fielding error by second baseman Vargas, Stewart to second. |
 |
9th Inning | Ginkel relieved Garcia |
|
9th Inning | Stewart singled to right. |
|
9th Inning | De La Cruz grounded out to second. |
|
9th Inning | Rodríguez struck out swinging. |
Statistics
 CIN |
 ARI |
|
|---|---|---|
| 1 | Games Played | 1 |
| 1 | Team Games Played | 1 |
| 1 | Hit By Pitch | 0 |
| 12 | Ground Balls | 9 |
| 11 | Strikeouts | 7 |
| 3 | Runs Batted In | 5 |
| 0 | Sacrifice Hit | 1 |
| 8 | Hits | 8 |
| 0 | Stolen Bases | 0 |
| 5 | Walks | 4 |
| 0 | Catcher Interference | 0 |
| 3 | Runs | 5 |
| 1 | Ground Into Double Play | 1 |
| 0 | Sacrifice Flies | 2 |
| 34 | At Bats | 28 |
| 0 | Home Runs | 0 |
| 0 | Grand Slam Home Runs | 0 |
| 19 | Runners Left On Base | 11 |
| 0 | Triples | 2 |
| 0 | Game Winning RBIs | 1 |
| 0 | Intentional Walks | 0 |
| 3 | Doubles | 2 |
| 11 | Fly Balls | 15 |
| 0 | Caught Stealing | 0 |
| 166 | Pitches | 118 |
| 0 | Games Started | 0 |
| 1 | Pinch At Bats | 1 |
| 0 | Pinch Hits | 0 |
| 0.0 | Player Rating | 0.0 |
| 1 | Is Qualified | 1 |
| 0 | Is Qualified In Steals | 0 |
| 11 | Total Bases | 14 |
| 40 | Plate Appearances | 35 |
| 0.0 | Projected Home Runs | 0.0 |
| 3 | Extra Base Hits | 4 |
| 4.0 | Runs Created | 5.1 |
| .235 | Batting Average | .286 |
| .000 | Pinch Hit Average | .000 |
| .324 | Slugging Percentage | .500 |
| .235 | Secondary Average | .357 |
| .350 | On Base Percentage | .353 |
| .674 | OBP Pct + SLG Pct | .853 |
| 1.1 | Ground To Fly Ball Ratio | 0.6 |
| 4.0 | Runs Created Per 27 Outs | 5.8 |
| 26.0 | Batter Rating | 37.0 |
| 0.0 | At Bats Per Home Run | 0.0 |
| 0.00 | Stolen Base Percentage | 0.00 |
| 4.15 | Pitches Per Plate Appearance | 3.37 |
| .088 | Isolated Power | .214 |
| 0.45 | Walk To Strikeout Ratio | 0.57 |
| .125 | Walks Per Plate Appearance | .114 |
| .000 | Secondary Average Minus Batting Average | .071 |
| 6.0 | Runs Produced | 10.0 |
| 1.0 | Runs Ratio | 1.0 |
| 0.4 | Patience Ratio | 0.6 |
| 0.3 | Balls In Play Average | 0.4 |
| 76.3 | MLB Rating | 86.0 |
| 0.0 | Offensive Wins Above Replacement | 0.0 |
| 0.0 | Wins Above Replacement | 0.0 |
Game Information
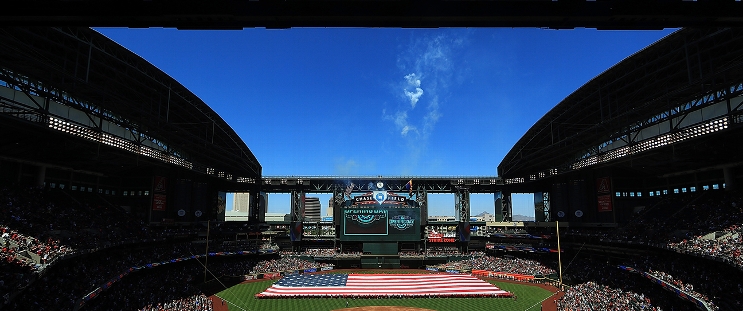
Location: Phoenix, Arizona
Attendance: 28,433 | Capacity:
2026 National League Central Standings
| TEAM | W | L | PCT | GB | STRK |
|---|---|---|---|---|---|
 Milwaukee |
- | 59 | W5 | 0.63580245 | 103 |
 Chicago |
14 | 73 | W1 | 0.5493827 | 89 |
 Pittsburgh |
21 | 80 | W1 | 0.50617284 | 82 |
 St. Louis |
26 | 85 | L4 | 0.47530866 | 77 |
| Cincinnati |
28 | 87 | L1 | 0.46296296 | 75 |
2026 National League West Standings
| TEAM | W | L | PCT | GB | STRK |
|---|---|---|---|---|---|
 Los Angeles |
- | 62 | W3 | 0.61728394 | 100 |
 San Diego |
9 | 71 | W2 | 0.5617284 | 91 |
| Arizona |
14 | 76 | L2 | 0.5308642 | 86 |
 San Francisco |
35 | 97 | L5 | 0.40123457 | 65 |
 Colorado |
42 | 104 | L1 | 0.3580247 | 58 |