
Chicago Cubs at Arizona Diamondbacks
· Major League Baseball
7 - 0

Conforto and Kelly hit back-to-back HRs, lift the Cubs over the Diamondbacks 7-0

The Cubs moved to 5 1/2 games behind the Milwaukee Brewers for the NL Central lead. The Brewers were off Monday.
Conforto and Kelly hit their homers off reliever Taylor Clarke with two outs in the sixth, breaking open a tight game. Conforto's two-run shot to right field made it 4-0 and then Kelly — who played 4 1/2 seasons with the Diamondbacks — hurt his former team with a solo smash to left.
That was plenty of support for Gausman (2-1), who cruised through the D-backs' lineup, needing just 94 pitches to complete his seven innings. The right-hander gave up three hits and a walk while striking out six in his best outing for the Cubs since being acquired at the trade deadline from the Toronto Blue Jays.
The Cubs took a 1-0 lead in the second when Pedro Ramírez smacked a triple down the right-field line that scored Ian Happ. They pushed the advantage to 2-0 in the fifth when Seiya Suzuki's double off the left-field wall brought home Conforto.
Conforto reached base four times, hitting a single, double and homer while also drawing a walk. Happ and Ramírez both had two hits.
D-backs right-hander Merrill Kelly (8-12) gave up three runs on five hits and three walks over 5 2/3 innings. He struck out four.
Arizona managed just five hits — all of them singles. Corbin Carroll stole two bases.
See AP’s full MLB coverage here
How can I watch Chicago Cubs vs. Arizona Diamondbacks?
- TV Channel: Cubs at Diamondbacks 2022 MLB Baseball, is broadcasted on MLB.TV.
- Online streaming: Sign up for Fubo.
Scoring Summary
 |
9th Inning | Lawlar lined out to left. |
|
9th Inning | Lawlar hit for Kepler |
|
9th Inning | Perdomo reached on infield single to second, Fernandez to second. |
|
9th Inning | Moreno flied out to right. |
|
9th Inning | Carroll lined out to left. |
|
9th Inning | Fernandez singled to center. |
Statistics
 CHC |
 ARI |
|
|---|---|---|
| 1 | Games Played | 1 |
| 1 | Team Games Played | 1 |
| 0 | Hit By Pitch | 0 |
| 10 | Ground Balls | 11 |
| 4 | Strikeouts | 6 |
| 7 | Runs Batted In | 0 |
| 0 | Sacrifice Hit | 0 |
| 10 | Hits | 5 |
| 0 | Stolen Bases | 2 |
| 4 | Walks | 1 |
| 0 | Catcher Interference | 0 |
| 7 | Runs | 0 |
| 0 | Ground Into Double Play | 0 |
| 1 | Sacrifice Flies | 0 |
| 36 | At Bats | 31 |
| 2 | Home Runs | 0 |
| 0 | Grand Slam Home Runs | 0 |
| 12 | Runners Left On Base | 11 |
| 1 | Triples | 0 |
| 1 | Game Winning RBIs | 0 |
| 0 | Intentional Walks | 0 |
| 3 | Doubles | 0 |
| 23 | Fly Balls | 14 |
| 0 | Caught Stealing | 1 |
| 159 | Pitches | 126 |
| 0 | Games Started | 0 |
| 0 | Pinch At Bats | 2 |
| 0 | Pinch Hits | 1 |
| 0.0 | Player Rating | 0.0 |
| 1 | Is Qualified | 1 |
| 0 | Is Qualified In Steals | 1 |
| 21 | Total Bases | 5 |
| 41 | Plate Appearances | 32 |
| 324.0 | Projected Home Runs | 0.0 |
| 6 | Extra Base Hits | 0 |
| 7.4 | Runs Created | 0.3 |
| .278 | Batting Average | .161 |
| .000 | Pinch Hit Average | .500 |
| .583 | Slugging Percentage | .161 |
| .417 | Secondary Average | .065 |
| .341 | On Base Percentage | .188 |
| .925 | OBP Pct + SLG Pct | .349 |
| 0.4 | Ground To Fly Ball Ratio | 0.8 |
| 7.4 | Runs Created Per 27 Outs | 0.3 |
| 52.5 | Batter Rating | 7.0 |
| 18.0 | At Bats Per Home Run | 0.0 |
| 0.00 | Stolen Base Percentage | 0.67 |
| 3.88 | Pitches Per Plate Appearance | 3.94 |
| .306 | Isolated Power | .000 |
| 1.00 | Walk To Strikeout Ratio | 0.17 |
| .098 | Walks Per Plate Appearance | .031 |
| .139 | Secondary Average Minus Batting Average | -.097 |
| 14.0 | Runs Produced | 0.0 |
| 1.0 | Runs Ratio | 0.0 |
| 0.6 | Patience Ratio | 0.2 |
| 0.3 | Balls In Play Average | 0.2 |
| 97.8 | MLB Rating | 61.5 |
| 0.0 | Offensive Wins Above Replacement | 0.0 |
| 0.0 | Wins Above Replacement | 0.0 |
Game Information
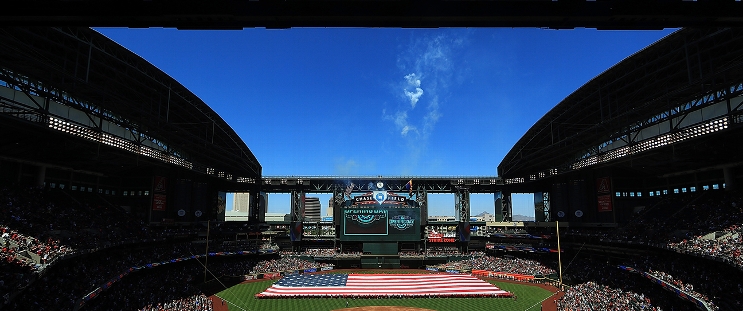
Location: Phoenix, Arizona
Attendance: 28,704 | Capacity:
2026 National League Central Standings
| TEAM | W | L | PCT | GB | STRK |
|---|---|---|---|---|---|
 Milwaukee |
- | 59 | W5 | 0.63580245 | 103 |
| Chicago |
14 | 73 | W1 | 0.5493827 | 89 |
 Pittsburgh |
21 | 80 | W1 | 0.50617284 | 82 |
 St. Louis |
26 | 85 | L4 | 0.47530866 | 77 |
 Cincinnati |
28 | 87 | L1 | 0.46296296 | 75 |
2026 National League West Standings
| TEAM | W | L | PCT | GB | STRK |
|---|---|---|---|---|---|
 Los Angeles |
- | 62 | W3 | 0.61728394 | 100 |
 San Diego |
9 | 71 | W2 | 0.5617284 | 91 |
| Arizona |
14 | 76 | L2 | 0.5308642 | 86 |
 San Francisco |
35 | 97 | L5 | 0.40123457 | 65 |
 Colorado |
42 | 104 | L1 | 0.3580247 | 58 |