
Pittsburgh Pirates at San Diego Padres
· Major League Baseball
3 - 2

Nick Gonzales' 12th-inning RBI single sends Pirates past Padres 3-2

Esmerlyn Valdez homered and Rafael Flores Jr. had an RBI double in the sixth for the Pirates, who rebounded from getting swept at Dodger Stadium last weekend with just their 11th win in 31 games.
Jake Cronenworth tied it in the eighth with a two-out RBI single for the Padres, whose three-game winning streak ended with only their eighth loss in 29 games. San Diego’s eight-game home winning streak also ended.
San Diego loaded the bases with one out in the 11th, but Kirby Yates (2-5) struck out Jackson Merrill and got Xander Bogaerts to line out. Merrill went 0 for 5 on his bobblehead night, striking out on three pitches with the bases loaded in both the eighth and 11th, and also failed to make a diving catch on Flores' RBI double.
After Jared Triolo scored on Gonzales’ single off Jeremiah Estrada (2-3), Yohan Ramirez struck out the side in the 12th to earn his second save.
Braxton Ashcraft pitched six strong innings of four-hit ball for Pittsburgh. He has allowed just three runs over 23 innings in his last three starts.
Robbie Ray dueled Ashcraft through five scoreless innings before Valdez led off the sixth with a 414-foot shot to center field. Ray allowed five hits and struck out five in his fourth start for the Padres.
Freddy Fermin doubled later in the sixth and eventually scored on Ashcraft's balk.
Padres closer Mason Miller allowed two baserunners and barely escaped a ninth-inning jam while facing his hometown team on his 28th birthday.
How can I watch Pittsburgh Pirates vs. San Diego Padres?
- TV Channel: Pirates at Padres 2022 MLB Baseball, is broadcasted on MLB.TV.
- Online streaming: Sign up for Fubo.
Scoring Summary
 |
12th Inning | Harris struck out swinging. San Diego Padres challenged: call on the field was upheld. |
|
12th Inning | Campusano struck out swinging. |
|
12th Inning | Hays struck out swinging. |
 |
12th Inning | Ramírez relieved Yates |
|
12th Inning | Cruz struck out swinging. |
|
12th Inning | Mangum to second on wild pitch by Estrada. |
Statistics
 PIT |
 SD |
|
|---|---|---|
| 1 | Games Played | 1 |
| 1 | Team Games Played | 1 |
| 0 | Hit By Pitch | 0 |
| 18 | Ground Balls | 10 |
| 15 | Strikeouts | 10 |
| 3 | Runs Batted In | 1 |
| 0 | Sacrifice Hit | 0 |
| 9 | Hits | 7 |
| 2 | Stolen Bases | 3 |
| 5 | Walks | 6 |
| 0 | Catcher Interference | 0 |
| 3 | Runs | 2 |
| 1 | Ground Into Double Play | 3 |
| 0 | Sacrifice Flies | 0 |
| 44 | At Bats | 39 |
| 1 | Home Runs | 0 |
| 0 | Grand Slam Home Runs | 0 |
| 29 | Runners Left On Base | 26 |
| 0 | Triples | 0 |
| 1 | Game Winning RBIs | 0 |
| 1 | Intentional Walks | 0 |
| 1 | Doubles | 2 |
| 11 | Fly Balls | 19 |
| 0 | Caught Stealing | 0 |
| 220 | Pitches | 193 |
| 0 | Games Started | 0 |
| 2 | Pinch At Bats | 2 |
| 0 | Pinch Hits | 0 |
| 0.0 | Player Rating | 0.0 |
| 1 | Is Qualified | 1 |
| 1 | Is Qualified In Steals | 1 |
| 13 | Total Bases | 9 |
| 49 | Plate Appearances | 45 |
| 162.0 | Projected Home Runs | 0.0 |
| 2 | Extra Base Hits | 2 |
| 3.9 | Runs Created | 2.4 |
| .205 | Batting Average | .179 |
| .000 | Pinch Hit Average | .000 |
| .295 | Slugging Percentage | .231 |
| .250 | Secondary Average | .282 |
| .286 | On Base Percentage | .289 |
| .581 | OBP Pct + SLG Pct | .520 |
| 1.6 | Ground To Fly Ball Ratio | 0.5 |
| 2.9 | Runs Created Per 27 Outs | 1.8 |
| 28.0 | Batter Rating | 20.0 |
| 44.0 | At Bats Per Home Run | 0.0 |
| 1.00 | Stolen Base Percentage | 1.00 |
| 4.49 | Pitches Per Plate Appearance | 4.29 |
| .091 | Isolated Power | .051 |
| 0.33 | Walk To Strikeout Ratio | 0.60 |
| .102 | Walks Per Plate Appearance | .133 |
| .045 | Secondary Average Minus Batting Average | .103 |
| 6.0 | Runs Produced | 3.0 |
| 1.0 | Runs Ratio | 0.5 |
| 0.4 | Patience Ratio | 0.3 |
| 0.3 | Balls In Play Average | 0.2 |
| 76.3 | MLB Rating | 69.8 |
| 0.0 | Offensive Wins Above Replacement | 0.0 |
| 0.0 | Wins Above Replacement | 0.0 |
Game Information
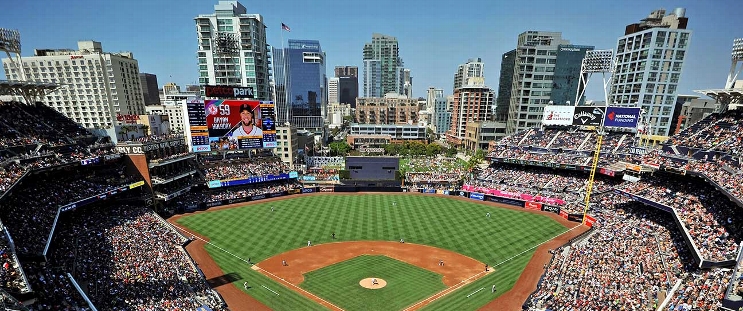
Location: San Diego, California
Attendance: 40,447 | Capacity:
2026 National League Central Standings
| TEAM | W | L | PCT | GB | STRK |
|---|---|---|---|---|---|
 Milwaukee |
- | 59 | W5 | 0.63580245 | 103 |
 Chicago |
14 | 73 | W1 | 0.5493827 | 89 |
| Pittsburgh |
21 | 80 | W1 | 0.50617284 | 82 |
 St. Louis |
26 | 85 | L4 | 0.47530866 | 77 |
 Cincinnati |
28 | 87 | L1 | 0.46296296 | 75 |
2026 National League West Standings
| TEAM | W | L | PCT | GB | STRK |
|---|---|---|---|---|---|
 Los Angeles |
- | 62 | W3 | 0.61728394 | 100 |
| San Diego |
9 | 71 | W2 | 0.5617284 | 91 |
 Arizona |
14 | 76 | L2 | 0.5308642 | 86 |
 San Francisco |
35 | 97 | L5 | 0.40123457 | 65 |
 Colorado |
42 | 104 | L1 | 0.3580247 | 58 |