
Cincinnati Reds at San Francisco Giants
· Major League Baseball
1 - 3

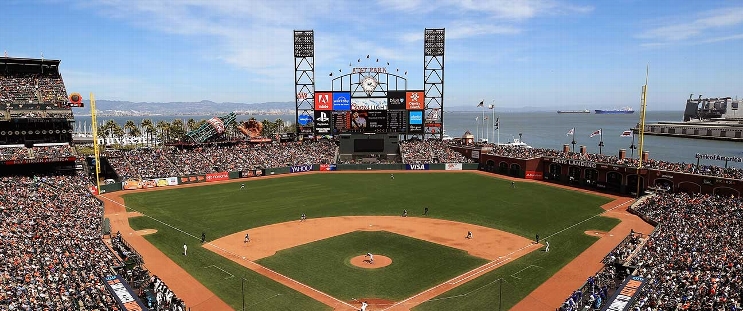
Rafael Devers bounces a homer into McCovey Cove as Giants beat Reds 3-1

Drew Cavanaugh hit a two-run single in the first inning for San Francisco before Devers went deep in the fifth, his third homer in five games. It was his 16th longball at Oracle Park this season, the most by a Giant since Barry Bonds in 2007.
Sal Stewart scored the Reds’ first run in 23 innings on his ninth-inning homer. His 28 home runs are the second most by a Reds rookie, trailing only Frank Robinson’s 38 in 1956.
Cavanaugh finished 3 for 3 for his first career three-hit game. Nate Furman got his first major league hit, a single in the third.
Molina (1-0) relieved right-hander Adrian Houser, who left in the second inning with an apparent injury to his throwing arm. He allowed one hit and fanned a batter.
It was the second straight game in which San Francisco's starter left with an injury. Left-hander Carson Whisenhunt exited in the third inning Monday, and the team said Tuesday he has a torn ulnar collateral ligament in his pitching elbow.
Brady Singer (5-12) allowed three runs on six hits over 5 2/3 innings for Cincinnati, striking out five.
See AP’s full MLB coverage here
How can I watch Cincinnati Reds vs. San Francisco Giants?
- TV Channel: Reds at Giants 2022 MLB Baseball, is broadcasted on MLB.TV.
- Online streaming: Sign up for Fubo.
Scoring Summary
 |
9th Inning | Suárez struck out looking. |
|
9th Inning | Stephenson grounded out to third. |
|
9th Inning | Bleday grounded out to second. |
|
9th Inning | Stewart homered to right (355 feet). |
 |
9th Inning | Seymour relieved Harris |
|
8th Inning | Gilbert lined into double play, to third, McCray doubled off third. |
Statistics
 CIN |
 SF |
|
|---|---|---|
| 1 | Games Played | 1 |
| 1 | Team Games Played | 1 |
| 0 | Hit By Pitch | 2 |
| 12 | Ground Balls | 14 |
| 6 | Strikeouts | 6 |
| 1 | Runs Batted In | 3 |
| 0 | Sacrifice Hit | 1 |
| 4 | Hits | 8 |
| 0 | Stolen Bases | 1 |
| 2 | Walks | 3 |
| 0 | Catcher Interference | 0 |
| 1 | Runs | 3 |
| 0 | Ground Into Double Play | 0 |
| 0 | Sacrifice Flies | 0 |
| 30 | At Bats | 31 |
| 1 | Home Runs | 1 |
| 0 | Grand Slam Home Runs | 0 |
| 10 | Runners Left On Base | 21 |
| 0 | Triples | 0 |
| 0 | Game Winning RBIs | 1 |
| 0 | Intentional Walks | 0 |
| 1 | Doubles | 1 |
| 12 | Fly Balls | 12 |
| 0 | Caught Stealing | 0 |
| 122 | Pitches | 125 |
| 0 | Games Started | 0 |
| 0 | Pinch At Bats | 2 |
| 0 | Pinch Hits | 0 |
| 0.0 | Player Rating | 0.0 |
| 1 | Is Qualified | 1 |
| 0 | Is Qualified In Steals | 1 |
| 8 | Total Bases | 12 |
| 32 | Plate Appearances | 37 |
| 162.0 | Projected Home Runs | 162.0 |
| 2 | Extra Base Hits | 2 |
| 1.2 | Runs Created | 5.0 |
| .133 | Batting Average | .258 |
| .000 | Pinch Hit Average | .000 |
| .267 | Slugging Percentage | .387 |
| .200 | Secondary Average | .258 |
| .188 | On Base Percentage | .361 |
| .454 | OBP Pct + SLG Pct | .748 |
| 1.0 | Ground To Fly Ball Ratio | 1.2 |
| 1.2 | Runs Created Per 27 Outs | 5.6 |
| 13.0 | Batter Rating | 26.0 |
| 30.0 | At Bats Per Home Run | 31.0 |
| 0.00 | Stolen Base Percentage | 1.00 |
| 3.81 | Pitches Per Plate Appearance | 3.38 |
| .133 | Isolated Power | .129 |
| 0.33 | Walk To Strikeout Ratio | 0.50 |
| .063 | Walks Per Plate Appearance | .081 |
| .067 | Secondary Average Minus Batting Average | .000 |
| 2.0 | Runs Produced | 6.0 |
| 1.0 | Runs Ratio | 1.0 |
| 0.3 | Patience Ratio | 0.5 |
| 0.1 | Balls In Play Average | 0.3 |
| 65.5 | MLB Rating | 79.5 |
| 0.0 | Offensive Wins Above Replacement | 0.0 |
| 0.0 | Wins Above Replacement | 0.0 |
Game Information
Location: San Francisco, California
Attendance: 27,207 | Capacity:
2026 National League Central Standings
| TEAM | W | L | PCT | GB | STRK |
|---|---|---|---|---|---|
 Milwaukee |
- | 59 | W5 | 0.63580245 | 103 |
 Chicago |
14 | 73 | W1 | 0.5493827 | 89 |
 Pittsburgh |
21 | 80 | W1 | 0.50617284 | 82 |
 St. Louis |
26 | 85 | L4 | 0.47530866 | 77 |
| Cincinnati |
28 | 87 | L1 | 0.46296296 | 75 |
2026 National League West Standings
| TEAM | W | L | PCT | GB | STRK |
|---|---|---|---|---|---|
 Los Angeles |
- | 62 | W3 | 0.61728394 | 100 |
 San Diego |
9 | 71 | W2 | 0.5617284 | 91 |
 Arizona |
14 | 76 | L2 | 0.5308642 | 86 |
| San Francisco |
35 | 97 | L5 | 0.40123457 | 65 |
 Colorado |
42 | 104 | L1 | 0.3580247 | 58 |