
San Diego Padres at Cincinnati Reds
· Major League Baseball
3 - 4

Trevino singles in go-ahead run in 8th as Reds beat wild-card chasing Padres 4-3

San Diego (73-66) began the day with a half-game lead on Arizona for the third and final NL wild-card spot. The Diamondbacks hosted the Phillies later Tuesday night.
With the score tied at 2 in the eighth, the Reds loaded the bases with one out against Adrian Morejon (9-3). Trevino lined a sharp single to center, scoring Elly De La Cruz with the go-ahead run.
Juan Brito followed with a sacrifice fly to give the Reds a two-run cushion.
Emilio Pagán allowed a solo homer to Fernando Tatis, his second of the night, in the ninth but secured his 20th save.
Brock Burke (6-5) got the win for Cincinnati.
Samad Taylor tripled for the second time this season and scored on Manny Machado's sacrifice fly to put the Padres ahead 1-0 in the first.
The Reds tied it in the bottom half when Hector Rodriguez doubled and later scored on JJ Bleday's single.
Tatis put the Padres ahead 2-1 in the fifth with his 18th home run.
Reds left-hander Nick Lodolo allowed two earned runs and five hits with two walks and five strikeouts while tying a season high with 100 pitches.
Edwin Arroyo doubled in the fifth and scored on Rodriguez's single to tie it at 2.
Padres starter Randy Vazquez allowed two earned runs and five hits in 4 2/3 innings with a walk and three strikeouts.
San Diego missed a couple scoring chances late in Tuesday's game.
They had runners on first and second with no outs in the seventh, but Reds right-hander Luis Mey worked out of the jam. In the eighth, Jackson Merrill doubled with two outs, but Brock Burke struck out Luis Campusano to end the inning.
—
See AP’s full MLB coverage here
How can I watch San Diego Padres vs. Cincinnati Reds?
- TV Channel: Padres at Reds 2022 MLB Baseball, is broadcasted on MLB.TV.
- Online streaming: Sign up for Fubo.
Scoring Summary
 |
9th Inning | Taylor struck out swinging. |
|
9th Inning | Tatis Jr. homered to right (361 feet). |
|
9th Inning | Cronenworth flied out to left. |
|
9th Inning | Cronenworth hit for Bowen |
|
9th Inning | Song flied out to center. |
 |
9th Inning | Pagán relieved Burke |
Statistics
 SD |
 CIN |
|
|---|---|---|
| 1 | Games Played | 1 |
| 1 | Team Games Played | 1 |
| 1 | Hit By Pitch | 0 |
| 5 | Ground Balls | 9 |
| 10 | Strikeouts | 7 |
| 3 | Runs Batted In | 4 |
| 0 | Sacrifice Hit | 0 |
| 7 | Hits | 8 |
| 3 | Stolen Bases | 0 |
| 4 | Walks | 4 |
| 1 | Catcher Interference | 0 |
| 3 | Runs | 4 |
| 1 | Ground Into Double Play | 0 |
| 1 | Sacrifice Flies | 1 |
| 31 | At Bats | 30 |
| 2 | Home Runs | 0 |
| 0 | Grand Slam Home Runs | 0 |
| 18 | Runners Left On Base | 13 |
| 2 | Triples | 0 |
| 0 | Game Winning RBIs | 1 |
| 1 | Intentional Walks | 1 |
| 1 | Doubles | 2 |
| 17 | Fly Balls | 15 |
| 1 | Caught Stealing | 1 |
| 152 | Pitches | 141 |
| 0 | Games Started | 0 |
| 3 | Pinch At Bats | 1 |
| 0 | Pinch Hits | 0 |
| 0.0 | Player Rating | 0.0 |
| 1 | Is Qualified | 1 |
| 1 | Is Qualified In Steals | 1 |
| 18 | Total Bases | 10 |
| 38 | Plate Appearances | 35 |
| 324.0 | Projected Home Runs | 0.0 |
| 5 | Extra Base Hits | 2 |
| 6.0 | Runs Created | 3.6 |
| .226 | Batting Average | .267 |
| .000 | Pinch Hit Average | .000 |
| .581 | Slugging Percentage | .333 |
| .548 | Secondary Average | .167 |
| .324 | On Base Percentage | .343 |
| .905 | OBP Pct + SLG Pct | .676 |
| 0.3 | Ground To Fly Ball Ratio | 0.6 |
| 6.0 | Runs Created Per 27 Outs | 4.0 |
| 35.0 | Batter Rating | 28.0 |
| 15.5 | At Bats Per Home Run | 0.0 |
| 0.75 | Stolen Base Percentage | 0.00 |
| 4.00 | Pitches Per Plate Appearance | 4.03 |
| .355 | Isolated Power | .067 |
| 0.40 | Walk To Strikeout Ratio | 0.57 |
| .105 | Walks Per Plate Appearance | .114 |
| .323 | Secondary Average Minus Batting Average | -.100 |
| 6.0 | Runs Produced | 8.0 |
| 1.0 | Runs Ratio | 1.0 |
| 0.7 | Patience Ratio | 0.4 |
| 0.3 | Balls In Play Average | 0.3 |
| 83.5 | MLB Rating | 78.8 |
| 0.0 | Offensive Wins Above Replacement | 0.0 |
| 0.0 | Wins Above Replacement | 0.0 |
Game Information
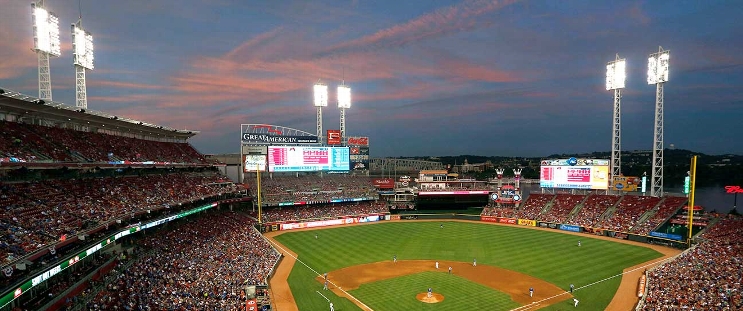
Location: Cincinnati, Ohio
Attendance: 19,376 | Capacity:
2026 National League West Standings
| TEAM | W | L | PCT | GB | STRK |
|---|---|---|---|---|---|
 Los Angeles |
- | 62 | W3 | 0.61728394 | 100 |
| San Diego |
9 | 71 | W2 | 0.5617284 | 91 |
 Arizona |
14 | 76 | L2 | 0.5308642 | 86 |
 San Francisco |
35 | 97 | L5 | 0.40123457 | 65 |
 Colorado |
42 | 104 | L1 | 0.3580247 | 58 |
2026 National League Central Standings
| TEAM | W | L | PCT | GB | STRK |
|---|---|---|---|---|---|
 Milwaukee |
- | 59 | W5 | 0.63580245 | 103 |
 Chicago |
14 | 73 | W1 | 0.5493827 | 89 |
 Pittsburgh |
21 | 80 | W1 | 0.50617284 | 82 |
 St. Louis |
26 | 85 | L4 | 0.47530866 | 77 |
| Cincinnati |
28 | 87 | L1 | 0.46296296 | 75 |