
San Diego Padres at Cincinnati Reds
· Major League Baseball
3 - 7

Brito, Bleday and Rodríguez homer, Reds score 7 unanswered runs to beat Padres 7-3

Despite winning the three-game series, Cincinnati (67-73) fell 6 1/2 games back of Arizona for the third and final NL wild card after the Diamondbacks beat the Phillies. San Diego was half a game behind Arizona.
Brito had a game-tying, three-run shot into the right-field seats in the third inning. Two batters later, Rodríguez tacked on a solo shot to give Cincinnati the lead. Rodríguez has five homers in his last 10 games.
Bleday capped the scoring in the seventh with his 22nd homer of the season, a two-run, 416-foot hit to help the Reds clinch the three-game series. Matt McLain added an RBI sacrifice fly in the sixth.
Brandon Williamson (3-3) pitched a season-best 5 1/3 innings for Cincinnati, striking out five and allowing three runs on seven hits. Pierce Johnson, Tejay Antone, Tony Santillan and Emilio Pagán went hitless out of the bullpen to seal the win.
Ty France gave San Diego a 2-0 lead in the first inning with his 20th home run of the season, and Fernando Tatis Jr. plated the Padres' final run in the second with an RBI single.
Casey Mize (5-9) threw four innings for the Padres and surrendered four runs on five hits with four strikeouts. Since being traded on Aug. 3 from the Detroit Tigers, Mize has 20 earned runs and 15 strikeouts in 27 innings pitched for San Diego.
Reds: RHP Rhett Lowder (6-8, 5.14) takes the mound Friday for the opener of a three-game series against the Milwaukee Brewers.
See AP’s full MLB coverage here
How can I watch San Diego Padres vs. Cincinnati Reds?
- TV Channel: Padres at Reds 2022 MLB Baseball, is broadcasted on MLB.TV.
- Online streaming: Sign up for Fubo.
Scoring Summary
 |
9th Inning | Cronenworth struck out swinging. |
|
9th Inning | Campusano popped out to first. |
|
9th Inning | Harris grounded out to second. |
 |
9th Inning | Pagán relieved Santillan |
|
9th Inning | Bleday in right field. |
|
9th Inning | Friedl in left field. |
Statistics
 SD |
 CIN |
|
|---|---|---|
| 1 | Games Played | 1 |
| 1 | Team Games Played | 1 |
| 0 | Hit By Pitch | 0 |
| 10 | Ground Balls | 11 |
| 10 | Strikeouts | 7 |
| 3 | Runs Batted In | 7 |
| 0 | Sacrifice Hit | 0 |
| 7 | Hits | 10 |
| 0 | Stolen Bases | 1 |
| 4 | Walks | 2 |
| 0 | Catcher Interference | 0 |
| 3 | Runs | 7 |
| 1 | Ground Into Double Play | 0 |
| 0 | Sacrifice Flies | 1 |
| 32 | At Bats | 34 |
| 1 | Home Runs | 3 |
| 0 | Grand Slam Home Runs | 0 |
| 16 | Runners Left On Base | 14 |
| 0 | Triples | 0 |
| 0 | Game Winning RBIs | 1 |
| 0 | Intentional Walks | 0 |
| 1 | Doubles | 1 |
| 12 | Fly Balls | 17 |
| 1 | Caught Stealing | 0 |
| 145 | Pitches | 161 |
| 0 | Games Started | 0 |
| 1 | Pinch At Bats | 0 |
| 0 | Pinch Hits | 0 |
| 0.0 | Player Rating | 0.0 |
| 1 | Is Qualified | 1 |
| 1 | Is Qualified In Steals | 1 |
| 11 | Total Bases | 20 |
| 36 | Plate Appearances | 37 |
| 162.0 | Projected Home Runs | 486.0 |
| 2 | Extra Base Hits | 4 |
| 2.9 | Runs Created | 6.8 |
| .219 | Batting Average | .294 |
| .000 | Pinch Hit Average | .000 |
| .344 | Slugging Percentage | .588 |
| .219 | Secondary Average | .382 |
| .306 | On Base Percentage | .324 |
| .649 | OBP Pct + SLG Pct | .913 |
| 0.8 | Ground To Fly Ball Ratio | 0.6 |
| 2.9 | Runs Created Per 27 Outs | 7.3 |
| 24.0 | Batter Rating | 50.0 |
| 32.0 | At Bats Per Home Run | 11.3 |
| 0.00 | Stolen Base Percentage | 1.00 |
| 4.03 | Pitches Per Plate Appearance | 4.35 |
| .125 | Isolated Power | .294 |
| 0.40 | Walk To Strikeout Ratio | 0.29 |
| .111 | Walks Per Plate Appearance | .054 |
| .000 | Secondary Average Minus Batting Average | .088 |
| 6.0 | Runs Produced | 14.0 |
| 1.0 | Runs Ratio | 1.0 |
| 0.4 | Patience Ratio | 0.6 |
| 0.3 | Balls In Play Average | 0.3 |
| 75.0 | MLB Rating | 96.3 |
| 0.0 | Offensive Wins Above Replacement | 0.0 |
| 0.0 | Wins Above Replacement | 0.0 |
Game Information
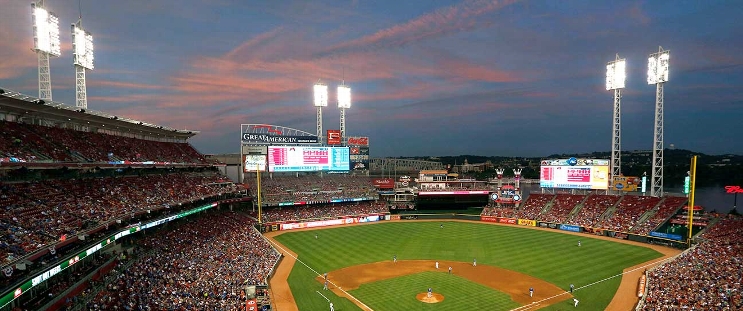
Location: Cincinnati, Ohio
Attendance: 14,632 | Capacity:
2026 National League West Standings
| TEAM | W | L | PCT | GB | STRK |
|---|---|---|---|---|---|
 Los Angeles |
- | 62 | W3 | 0.61728394 | 100 |
| San Diego |
9 | 71 | W2 | 0.5617284 | 91 |
 Arizona |
14 | 76 | L2 | 0.5308642 | 86 |
 San Francisco |
35 | 97 | L5 | 0.40123457 | 65 |
 Colorado |
42 | 104 | L1 | 0.3580247 | 58 |
2026 National League Central Standings
| TEAM | W | L | PCT | GB | STRK |
|---|---|---|---|---|---|
 Milwaukee |
- | 59 | W5 | 0.63580245 | 103 |
 Chicago |
14 | 73 | W1 | 0.5493827 | 89 |
 Pittsburgh |
21 | 80 | W1 | 0.50617284 | 82 |
 St. Louis |
26 | 85 | L4 | 0.47530866 | 77 |
| Cincinnati |
28 | 87 | L1 | 0.46296296 | 75 |