
St. Louis Cardinals at San Francisco Giants
· Major League Baseball
6 - 7

Whitcomb's double caps Giants' 6-run rally in a 7-6 victory over the Cardinals

With a runner at first and two outs in the eighth, Cade Winquest hit Brett Harris with a pitch and then walked Turner Hill. Bryce Eldridge followed with a two-run single to left to make it 6-3. George Soriano (6-5) replaced Winquest, and Jonah Cox hit an infield single that drove in another run. Jung Hoo Lee tied the game with a two-run double off the wall in right and scored the winning run on Whitcomb’s double to center.
Eldridge drove in three runs and extended his on-base streak to 18 games.
Left-hander Matt Wilkinson (1-3) pitched two shutout innings for his first major-league win. Trent Harris worked a scoreless ninth for his first career save.
Rookie Leo Bernal hit a three-run homer over the right field wall off starter Blade Tidwell to give the Cardinals a 4-1 lead in the third inning.
St. Louis starter Andre Pallante held the Giants to a run on five hits in five-plus innings. The right-hander struck out four and did not issue a walk.
Giants first baseman Rafael Devers did not play Wednesday. His games-played streak ended at 309 games, 236 of which came with San Francisco and the first 73 with Boston.
This marked the eighth consecutive game between the Cardinals and Giants that was decided by one run, including San Francisco’s 5-4 win in 11 innings Monday and its 2-1 victory Tuesday.
The Giants and RHP Anthony Molina (3-0, 2.79 ERA) host the Padres on Friday night.
AP MLB: MLB ' Latest News, Stats, and Scores
How can I watch St. Louis Cardinals vs. San Francisco Giants?
- TV Channel: Cardinals at Giants 2022 MLB Baseball, is broadcasted on MLB.TV.
- Online streaming: Sign up for Fubo.
Scoring Summary
 |
9th Inning | Herrera grounded out to third. |
|
9th Inning | Walker grounded into double play, shortstop to second to first, Fermín out at second. |
|
9th Inning | Walker hit for Urías |
|
9th Inning | Fermín singled to left. |
 |
9th Inning | T. Harris relieved Wilkinson |
|
8th Inning | Cavanaugh grounded out to second. |
Statistics
 STL |
 SF |
|
|---|---|---|
| 1 | Games Played | 1 |
| 1 | Team Games Played | 1 |
| 2 | Hit By Pitch | 1 |
| 15 | Ground Balls | 12 |
| 5 | Strikeouts | 9 |
| 5 | Runs Batted In | 7 |
| 0 | Sacrifice Hit | 0 |
| 8 | Hits | 10 |
| 1 | Stolen Bases | 1 |
| 3 | Walks | 1 |
| 0 | Catcher Interference | 0 |
| 6 | Runs | 7 |
| 2 | Ground Into Double Play | 1 |
| 1 | Sacrifice Flies | 0 |
| 32 | At Bats | 32 |
| 1 | Home Runs | 0 |
| 0 | Grand Slam Home Runs | 0 |
| 10 | Runners Left On Base | 12 |
| 0 | Triples | 0 |
| 0 | Game Winning RBIs | 1 |
| 0 | Intentional Walks | 0 |
| 1 | Doubles | 3 |
| 13 | Fly Balls | 11 |
| 0 | Caught Stealing | 1 |
| 126 | Pitches | 155 |
| 0 | Games Started | 0 |
| 2 | Pinch At Bats | 1 |
| 0 | Pinch Hits | 0 |
| 0.0 | Player Rating | 0.0 |
| 1 | Is Qualified | 1 |
| 1 | Is Qualified In Steals | 1 |
| 12 | Total Bases | 13 |
| 38 | Plate Appearances | 34 |
| 162.0 | Projected Home Runs | 0.0 |
| 2 | Extra Base Hits | 3 |
| 4.1 | Runs Created | 4.1 |
| .250 | Batting Average | .313 |
| .000 | Pinch Hit Average | .000 |
| .375 | Slugging Percentage | .406 |
| .250 | Secondary Average | .125 |
| .342 | On Base Percentage | .353 |
| .717 | OBP Pct + SLG Pct | .759 |
| 1.2 | Ground To Fly Ball Ratio | 1.1 |
| 4.1 | Runs Created Per 27 Outs | 4.6 |
| 36.0 | Batter Rating | 45.0 |
| 32.0 | At Bats Per Home Run | 0.0 |
| 1.00 | Stolen Base Percentage | 0.50 |
| 3.32 | Pitches Per Plate Appearance | 4.56 |
| .125 | Isolated Power | .094 |
| 0.60 | Walk To Strikeout Ratio | 0.11 |
| .079 | Walks Per Plate Appearance | .029 |
| .000 | Secondary Average Minus Batting Average | -.188 |
| 11.0 | Runs Produced | 14.0 |
| 0.8 | Runs Ratio | 1.0 |
| 0.5 | Patience Ratio | 0.4 |
| 0.3 | Balls In Play Average | 0.4 |
| 84.5 | MLB Rating | 88.8 |
| 0.0 | Offensive Wins Above Replacement | 0.0 |
| 0.0 | Wins Above Replacement | 0.0 |
Game Information
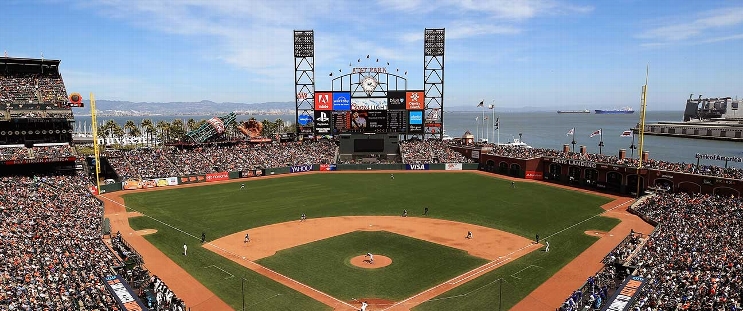
Location: San Francisco, California
Attendance: 27,487 | Capacity:
2026 National League Central Standings
| TEAM | W | L | PCT | GB | STRK |
|---|---|---|---|---|---|
 Milwaukee |
- | 59 | W5 | 0.63580245 | 103 |
 Chicago |
14 | 73 | W1 | 0.5493827 | 89 |
 Pittsburgh |
21 | 80 | W1 | 0.50617284 | 82 |
| St. Louis |
26 | 85 | L4 | 0.47530866 | 77 |
 Cincinnati |
28 | 87 | L1 | 0.46296296 | 75 |
2026 National League West Standings
| TEAM | W | L | PCT | GB | STRK |
|---|---|---|---|---|---|
 Los Angeles |
- | 62 | W3 | 0.61728394 | 100 |
 San Diego |
9 | 71 | W2 | 0.5617284 | 91 |
 Arizona |
14 | 76 | L2 | 0.5308642 | 86 |
| San Francisco |
35 | 97 | L5 | 0.40123457 | 65 |
 Colorado |
42 | 104 | L1 | 0.3580247 | 58 |