
Los Angeles Dodgers at Miami Marlins
· Major League Baseball
6 - 2

Kyle Tucker's grand slam helps Dodgers beat Marlins 6-2 for 8th straight win

Tucker connected on a 1-1 sweeper from reliever Cade Gibson for a 6-1 lead in the seventh. He singled in the first and tripled in the sixth.
Max Muncy had three hits and a walk and Will Smith added a run-scoring single for the NL West-leading Dodgers.
Blake Snell (4-1) allowed one run and struck out eight while scattering four hits over 5 2/3 innings.
After the Dodgers took a 2-0 lead on Smith's RBI single, Agustín Ramírez hit a run-scoring double that narrowed it to 2-1. Victor Vodnik began the seventh by quickly retiring Alex Freeland and Enrique Hernández but walked Tommy Edman and Mookie Betts and allowed a single to Muncy to load the bases, setting up Tucker's drive to right-center off Gibson.
Otto Lopez had four hits and Javier Sanoja tripled and singled for the Marlins, who have lost seven of eight and four straight. Starter Ryan Gusto (1-5) allowed two runs on five hits. The right-hander walked three and struck out three.
Pinch-hitter Owen Caissie's sacrifice fly tacked on another run for the Marlins in the eighth.
The Dodgers took a 1-0 lead on Tucker’s deep sacrifice fly that drove in Edman as “Let’s go Dodgers” chants erupted from the crowd of 29,370 at Miami’s loanDepot park.
Top prospect Josue De Paula went 1-for-3 in his major league debut after being called up to fill the roster spot of Shohei Ohtani, who went on the 15-day injured list Thursday with right biceps inflammation.
See AP’s full MLB coverage here
How can I watch Los Angeles Dodgers vs. Miami Marlins?
- TV Channel: Dodgers at Marlins 2022 MLB Baseball, is broadcasted on MLB.TV.
- Online streaming: Sign up for Fubo.
Scoring Summary
 |
9th Inning | Marsee struck out swinging. |
|
9th Inning | Lopez singled to left, Conine to second. |
|
9th Inning | Hernández flied out to center. |
|
9th Inning | Conine singled to right. |
|
9th Inning | Mack flied out to center. |
 |
9th Inning | Henriquez relieved Treinen |
Statistics
 LAD |
 MIA |
|
|---|---|---|
| 1 | Games Played | 1 |
| 1 | Team Games Played | 1 |
| 0 | Hit By Pitch | 0 |
| 7 | Ground Balls | 9 |
| 6 | Strikeouts | 11 |
| 6 | Runs Batted In | 2 |
| 0 | Sacrifice Hit | 0 |
| 8 | Hits | 9 |
| 0 | Stolen Bases | 1 |
| 5 | Walks | 3 |
| 0 | Catcher Interference | 0 |
| 6 | Runs | 2 |
| 0 | Ground Into Double Play | 0 |
| 1 | Sacrifice Flies | 1 |
| 33 | At Bats | 35 |
| 1 | Home Runs | 0 |
| 1 | Grand Slam Home Runs | 0 |
| 11 | Runners Left On Base | 14 |
| 1 | Triples | 1 |
| 1 | Game Winning RBIs | 0 |
| 0 | Intentional Walks | 1 |
| 0 | Doubles | 1 |
| 21 | Fly Balls | 16 |
| 1 | Caught Stealing | 1 |
| 137 | Pitches | 169 |
| 0 | Games Started | 0 |
| 1 | Pinch At Bats | 1 |
| 0 | Pinch Hits | 0 |
| 0.0 | Player Rating | 0.0 |
| 1 | Is Qualified | 1 |
| 1 | Is Qualified In Steals | 1 |
| 13 | Total Bases | 12 |
| 39 | Plate Appearances | 39 |
| 162.0 | Projected Home Runs | 0.0 |
| 2 | Extra Base Hits | 2 |
| 4.5 | Runs Created | 3.8 |
| .242 | Batting Average | .257 |
| .000 | Pinch Hit Average | .000 |
| .394 | Slugging Percentage | .343 |
| .273 | Secondary Average | .171 |
| .333 | On Base Percentage | .308 |
| .727 | OBP Pct + SLG Pct | .651 |
| 0.3 | Ground To Fly Ball Ratio | 0.6 |
| 4.5 | Runs Created Per 27 Outs | 3.7 |
| 37.5 | Batter Rating | 22.5 |
| 33.0 | At Bats Per Home Run | 0.0 |
| 0.00 | Stolen Base Percentage | 0.50 |
| 3.51 | Pitches Per Plate Appearance | 4.33 |
| .152 | Isolated Power | .086 |
| 0.83 | Walk To Strikeout Ratio | 0.27 |
| .128 | Walks Per Plate Appearance | .077 |
| .030 | Secondary Average Minus Batting Average | -.086 |
| 12.0 | Runs Produced | 4.0 |
| 1.0 | Runs Ratio | 1.0 |
| 0.5 | Patience Ratio | 0.4 |
| 0.3 | Balls In Play Average | 0.4 |
| 85.5 | MLB Rating | 75.8 |
| 0.0 | Offensive Wins Above Replacement | 0.0 |
| 0.0 | Wins Above Replacement | 0.0 |
Game Information
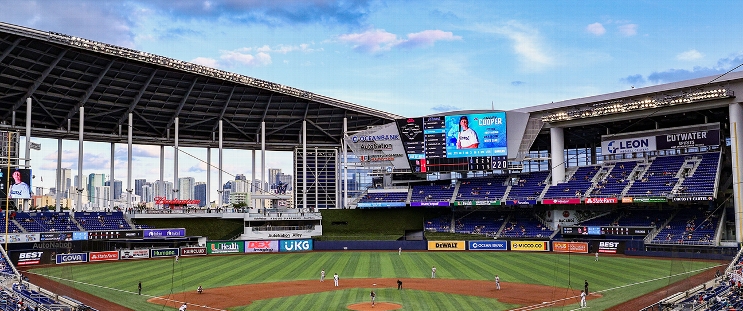
Location: Miami, Florida
Attendance: 29,370 | Capacity:
2026 National League West Standings
| TEAM | W | L | PCT | GB | STRK |
|---|---|---|---|---|---|
| Los Angeles |
- | 62 | W3 | 0.61728394 | 100 |
 San Diego |
9 | 71 | W2 | 0.5617284 | 91 |
 Arizona |
14 | 76 | L2 | 0.5308642 | 86 |
 San Francisco |
35 | 97 | L5 | 0.40123457 | 65 |
 Colorado |
42 | 104 | L1 | 0.3580247 | 58 |
2026 National League East Standings
| TEAM | W | L | PCT | GB | STRK |
|---|---|---|---|---|---|
 Atlanta |
- | 68 | L1 | 0.5802469 | 94 |
 Philadelphia |
6 | 74 | W1 | 0.54320985 | 88 |
| Miami |
14 | 82 | W1 | 0.49382716 | 80 |
 Washington |
17 | 85 | W1 | 0.47530866 | 77 |
 New York |
20 | 88 | L1 | 0.45679012 | 74 |