
Athletics at Tampa Bay Rays
· Major League Baseball
1 - 10

Rays open 5-game AL East lead, beat Athletics 10-1 for 6th straight win

Liam Hicks, Chandler Simpson, Richie Palacios and Taylor Walls had two RBI each for the AL-best Rays (93-59), who are assured of no worse than a wild card and are nearing their first AL East title since 2021. Simpson hit a go-ahead, two-run single in a six-run fourth.
Tampa Bay took three games from the A’s in its 16th series sweep, the most by an team since the 2022 Los Angeles Dodgers had 16. The Rays have 10 games left, including a four-game series next week at the second-place New York Yankees. They have won 10 of 12 and 16 of 23, moving 34 games over .500 for the first time since the end of the 2023 season.
Simpson had two hits and raised his batting average to an AL-best .311. He stole two bases, raising his AL-high total to 44.
Rasmussen (15-5) allowed four hits and two walks, stranding runners in scoring position in the third and fifth innings. Tampa Bay has won his last 11 starts, the most for a team behind an AL pitcher coming out of the All-Star break since Minnesota’s Johan Santana had 12 in 2006.
Former Rays pitcher Jeffrey Springs (4-14) gave up six runs and five hits in 3 1/3 innings. He is 1-14 in 24 starts since opening 3-0 in his first four outings.
Athletics outfielder Lawrence Butler had two hits and homered in the sixth off Casey Legumina. A’s reliever Joe Rock became the team’s 60th player this season.
Rays: LHP Ian Seymour (9-6. 4.27) starts Friday at home against Boston, which goes with LHP Ranger Suarez (7-4, 3.33).
See AP’s full MLB coverage here
How can I watch Athletics vs. Tampa Bay Rays?
- TV Channel: Athletics at Rays 2022 MLB Baseball, is broadcasted on MLB.TV.
- Online streaming: Sign up for Fubo.
Scoring Summary
 |
9th Inning | Heim grounded out to shortstop. |
|
9th Inning | Williams struck out swinging. |
|
9th Inning | White struck out swinging. |
 |
9th Inning | Cook relieved Matz |
|
8th Inning | Simpson grounded into fielder's choice to second, Fraley out at second. |
|
8th Inning | Rom relieved Tur |
Statistics
 ATH |
 TB |
|
|---|---|---|
| 1 | Games Played | 1 |
| 1 | Team Games Played | 1 |
| 0 | Hit By Pitch | 1 |
| 17 | Ground Balls | 8 |
| 8 | Strikeouts | 10 |
| 1 | Runs Batted In | 9 |
| 0 | Sacrifice Hit | 0 |
| 5 | Hits | 7 |
| 3 | Stolen Bases | 3 |
| 3 | Walks | 9 |
| 0 | Catcher Interference | 0 |
| 1 | Runs | 10 |
| 1 | Ground Into Double Play | 0 |
| 0 | Sacrifice Flies | 0 |
| 32 | At Bats | 32 |
| 1 | Home Runs | 0 |
| 0 | Grand Slam Home Runs | 0 |
| 12 | Runners Left On Base | 23 |
| 0 | Triples | 0 |
| 0 | Game Winning RBIs | 1 |
| 0 | Intentional Walks | 0 |
| 0 | Doubles | 2 |
| 7 | Fly Balls | 14 |
| 0 | Caught Stealing | 0 |
| 131 | Pitches | 172 |
| 0 | Games Started | 0 |
| 2 | Pinch At Bats | 1 |
| 0 | Pinch Hits | 0 |
| 0.0 | Player Rating | 0.0 |
| 1 | Is Qualified | 1 |
| 1 | Is Qualified In Steals | 1 |
| 8 | Total Bases | 9 |
| 35 | Plate Appearances | 42 |
| 162.0 | Projected Home Runs | 0.0 |
| 1 | Extra Base Hits | 2 |
| 1.9 | Runs Created | 5.6 |
| .156 | Batting Average | .219 |
| .000 | Pinch Hit Average | .000 |
| .250 | Slugging Percentage | .281 |
| .281 | Secondary Average | .438 |
| .229 | On Base Percentage | .405 |
| .479 | OBP Pct + SLG Pct | .686 |
| 2.4 | Ground To Fly Ball Ratio | 0.6 |
| 1.8 | Runs Created Per 27 Outs | 6.0 |
| 15.0 | Batter Rating | 52.0 |
| 32.0 | At Bats Per Home Run | 0.0 |
| 1.00 | Stolen Base Percentage | 1.00 |
| 3.74 | Pitches Per Plate Appearance | 4.10 |
| .094 | Isolated Power | .063 |
| 0.38 | Walk To Strikeout Ratio | 0.90 |
| .086 | Walks Per Plate Appearance | .214 |
| .125 | Secondary Average Minus Batting Average | .219 |
| 2.0 | Runs Produced | 19.0 |
| 1.0 | Runs Ratio | 0.9 |
| 0.3 | Patience Ratio | 0.5 |
| 0.2 | Balls In Play Average | 0.3 |
| 66.8 | MLB Rating | 88.5 |
| 0.0 | Offensive Wins Above Replacement | 0.0 |
| 0.0 | Wins Above Replacement | 0.0 |
Game Information
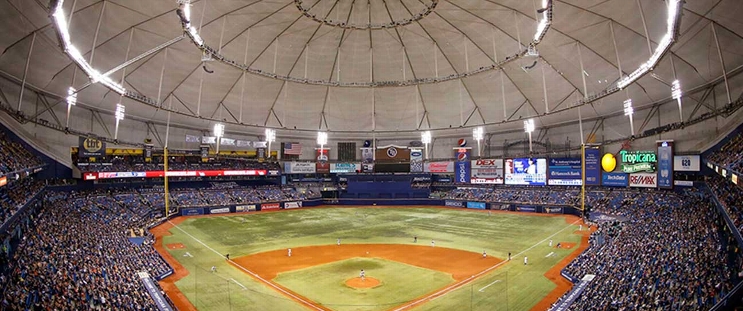
Location: St. Petersburg, Florida
Attendance: 12,305 | Capacity:
2026 American League West Standings
| TEAM | W | L | PCT | GB | STRK |
|---|---|---|---|---|---|
 Houston |
- | 81 | W2 | 0.5 | 81 |
 Texas |
1 | 82 | L1 | 0.49382716 | 80 |
 Seattle |
5 | 86 | W2 | 0.4691358 | 76 |
| Athletics |
17 | 98 | L2 | 0.39506173 | 64 |
 Los Angeles |
19 | 100 | L2 | 0.38271606 | 62 |
2026 American League East Standings
| TEAM | W | L | PCT | GB | STRK |
|---|---|---|---|---|---|
| Tampa Bay |
- | 64 | L1 | 0.60493827 | 98 |
 New York |
4.5 | 68 | W1 | 0.57763976 | 93 |
 Boston |
11 | 75 | L1 | 0.537037 | 87 |
 Baltimore |
18.5 | 82 | L1 | 0.49068323 | 79 |
 Toronto |
19 | 83 | W1 | 0.48765433 | 79 |