
San Diego Padres at Colorado Rockies
· Major League Baseball
9 - 2

Xander Bogaerts helps power a 7-run 2nd inning as the Padres roll past the reeling Rockies 9-2

Bogaerts finished a single shy of the fourth cycle in Padres history. He had two chances but struck out looking in the sixth and swinging to lead off the ninth.
His big game was part of a 15-hit afternoon for the Padres, who took three of four from Colorado. San Diego moved four games ahead of idle Arizona for the last National League wild-card spot.
Michael King (12-9) settled in after giving up a leadoff triple to Jake McCarthy and a run-scoring single to Connor Norby. King went six innings and allowed two runs in his staff-leading 31st start of the season.
Dustin Harris had three singles and drove in three runs to help the Padres win for the 10th time in 11 games. They finished with eight extra-base hits.
Colorado's Tanner Gordon (1-5) allowed 10 hits and seven runs over three innings. His rough outing extended a streak of a Rockies starter failing to notch the win to 20 games.
It was an adventurous second inning for right fielder Zac Veen, who saw back-to-back hits to him turn into triples. He slid to catch Jackson Merrill's looping ball near the line only to have it bounce off him. Bogaerts followed with a sinking liner and Veen trying to make a diving catch. The ball got by him and rolled to the wall.
Colorado needs to go 7-2 the rest of the way to avoid becoming the first team with four straight 100-loss seasons since the 1962-65 New York Mets.
Rockies: Colorado hasn't named a starter for Friday to start a three-game series with Seattle.
See AP’s full MLB coverage here
How can I watch San Diego Padres vs. Colorado Rockies?
- TV Channel: Padres at Rockies 2022 MLB Baseball, is broadcasted on ESPN Unlmtd.
- Online streaming: Sign up for Fubo.
Scoring Summary
 |
9th Inning | Veen flied out to left. |
|
9th Inning | Sullivan singled to center. |
|
9th Inning | Johnston grounded into double play, second to shortstop to first, Moniak out at second. |
|
9th Inning | Moniak singled to center. |
 |
9th Inning | Taylor struck out swinging. |
|
9th Inning | Cronenworth popped out to third. |
Statistics
 SD |
 COL |
|
|---|---|---|
| 1 | Games Played | 1 |
| 1 | Team Games Played | 1 |
| 1 | Hit By Pitch | 0 |
| 13 | Ground Balls | 9 |
| 9 | Strikeouts | 9 |
| 9 | Runs Batted In | 2 |
| 0 | Sacrifice Hit | 0 |
| 15 | Hits | 9 |
| 0 | Stolen Bases | 1 |
| 3 | Walks | 3 |
| 0 | Catcher Interference | 0 |
| 9 | Runs | 2 |
| 1 | Ground Into Double Play | 3 |
| 1 | Sacrifice Flies | 0 |
| 40 | At Bats | 33 |
| 1 | Home Runs | 0 |
| 0 | Grand Slam Home Runs | 0 |
| 15 | Runners Left On Base | 12 |
| 3 | Triples | 1 |
| 1 | Game Winning RBIs | 0 |
| 0 | Intentional Walks | 0 |
| 4 | Doubles | 0 |
| 19 | Fly Balls | 15 |
| 0 | Caught Stealing | 0 |
| 186 | Pitches | 138 |
| 0 | Games Started | 0 |
| 2 | Pinch At Bats | 0 |
| 0 | Pinch Hits | 0 |
| 0.0 | Player Rating | 0.0 |
| 1 | Is Qualified | 1 |
| 0 | Is Qualified In Steals | 1 |
| 28 | Total Bases | 11 |
| 45 | Plate Appearances | 36 |
| 162.0 | Projected Home Runs | 0.0 |
| 8 | Extra Base Hits | 1 |
| 10.6 | Runs Created | 3.0 |
| .375 | Batting Average | .273 |
| .000 | Pinch Hit Average | .000 |
| .700 | Slugging Percentage | .333 |
| .400 | Secondary Average | .182 |
| .422 | On Base Percentage | .333 |
| 1.122 | OBP Pct + SLG Pct | .667 |
| 0.7 | Ground To Fly Ball Ratio | 0.6 |
| 10.6 | Runs Created Per 27 Outs | 3.0 |
| 69.5 | Batter Rating | 20.5 |
| 40.0 | At Bats Per Home Run | 0.0 |
| 0.00 | Stolen Base Percentage | 1.00 |
| 4.13 | Pitches Per Plate Appearance | 3.83 |
| .325 | Isolated Power | .061 |
| 0.33 | Walk To Strikeout Ratio | 0.33 |
| .067 | Walks Per Plate Appearance | .083 |
| .025 | Secondary Average Minus Batting Average | -.091 |
| 18.0 | Runs Produced | 4.0 |
| 1.0 | Runs Ratio | 1.0 |
| 0.7 | Patience Ratio | 0.4 |
| 0.5 | Balls In Play Average | 0.4 |
| 112.8 | MLB Rating | 75.8 |
| 0.0 | Offensive Wins Above Replacement | 0.0 |
| 0.0 | Wins Above Replacement | 0.0 |
Game Information
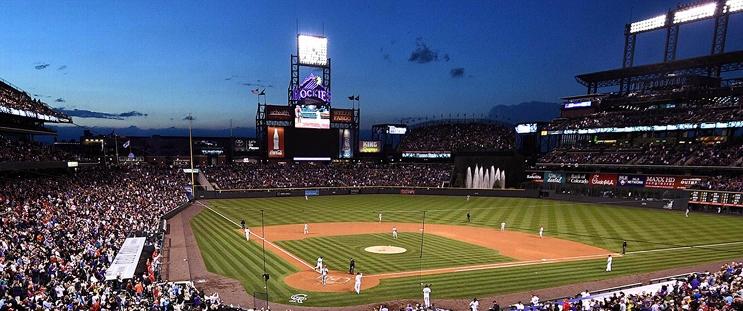
Location: Denver, Colorado
Attendance: 16,674 | Capacity:
2026 National League West Standings
| TEAM | W | L | PCT | GB | STRK |
|---|---|---|---|---|---|
 Los Angeles |
- | 62 | W3 | 0.61728394 | 100 |
| San Diego |
9 | 71 | W2 | 0.5617284 | 91 |
 Arizona |
14 | 76 | L2 | 0.5308642 | 86 |
 San Francisco |
35 | 97 | L5 | 0.40123457 | 65 |
| Colorado |
42 | 104 | L1 | 0.3580247 | 58 |