
Minnesota Twins at Los Angeles Angels
· Major League Baseball
4 - 5

Angels blow 9th-inning lead, then rally for 2 in the 10th to edge Twins 5-4

Minnesota rookie Walker Jenkins hit a two-out, two-run homer in top of the ninth for a 3-3 tie, and the Twins took a 4-3 lead in the 10th on Brooks Lee’s RBI single.
Kody Clemens’ sacrifice bunt put runners on second and third with one out, but Angels left-hander Blake Weiman (1-1) got Josh Bell to pop to second and, after intentionally walking pinch-hitter Ryan Jeffers, struck out Royce Lewis to end the inning.
Automatic runner Jose Siri took third on pinch-hitter Vaughn Grissom’s fly to left to open the bottom of the 10th. Zach Neto walked, Trout singled off Yoendrys Gomez (2-4) for a 4-4 tie, and Meckler singled off left-hander Kody Funderburk for the win.
The Angels were one out away from a 3-1 victory after hard-throwing closer Ben Joyce struck out Emmanuel Rodriguez and Lewis to open the ninth, but Twins catcher Victor Caratini kept the inning alive with a single to center.
Jenkins, who entered Thursday with an .089 average and one homer in 16 big-league games, then drove a 101-mph fastball just beyond the glove of leaping center fielder Siri for a two-run shot that tied it at 3.
Minnesota’s late rally spoiled a superb start by Angels right-hander Walbert Ureña, who allowed four hits, struck out a career-high nine and walked none over seven shutout innings to lower his ERA to 2.74.
Twins starter Taj Bradley allowed three runs and five hits in seven innings, striking out nine and walking one, but the right-hander gave up four of those hits in a three-run first.
See AP’s full MLB coverage here
How can I watch Minnesota Twins vs. Los Angeles Angels?
- TV Channel: Twins at Angels 2022 MLB Baseball, is broadcasted on MLB.TV.
- Online streaming: Sign up for Fubo.
Scoring Summary
 |
10th Inning | Meckler singled to right, Neto scored, Trout to second. |
 |
10th Inning | Funderburk relieved Gómez |
|
10th Inning | Kreidler in left field. |
|
10th Inning | Trout singled to left, Siri scored, Neto to third. |
|
10th Inning | Neto walked. |
|
10th Inning | Grissom flied out to left, Siri to third. |
Statistics
 MIN |
 LAA |
|
|---|---|---|
| 1 | Games Played | 1 |
| 1 | Team Games Played | 1 |
| 0 | Hit By Pitch | 0 |
| 12 | Ground Balls | 11 |
| 15 | Strikeouts | 14 |
| 4 | Runs Batted In | 5 |
| 1 | Sacrifice Hit | 0 |
| 10 | Hits | 8 |
| 0 | Stolen Bases | 2 |
| 2 | Walks | 3 |
| 0 | Catcher Interference | 0 |
| 4 | Runs | 5 |
| 0 | Ground Into Double Play | 0 |
| 1 | Sacrifice Flies | 0 |
| 38 | At Bats | 36 |
| 1 | Home Runs | 0 |
| 0 | Grand Slam Home Runs | 0 |
| 14 | Runners Left On Base | 9 |
| 0 | Triples | 0 |
| 0 | Game Winning RBIs | 1 |
| 1 | Intentional Walks | 1 |
| 1 | Doubles | 1 |
| 13 | Fly Balls | 11 |
| 0 | Caught Stealing | 0 |
| 145 | Pitches | 149 |
| 0 | Games Started | 0 |
| 0 | Pinch At Bats | 1 |
| 0 | Pinch Hits | 0 |
| 0.0 | Player Rating | 0.0 |
| 1 | Is Qualified | 1 |
| 0 | Is Qualified In Steals | 1 |
| 14 | Total Bases | 9 |
| 42 | Plate Appearances | 39 |
| 162.0 | Projected Home Runs | 0.0 |
| 2 | Extra Base Hits | 1 |
| 4.3 | Runs Created | 2.9 |
| .263 | Batting Average | .222 |
| .000 | Pinch Hit Average | .000 |
| .368 | Slugging Percentage | .250 |
| .158 | Secondary Average | .167 |
| .293 | On Base Percentage | .282 |
| .661 | OBP Pct + SLG Pct | .532 |
| 0.9 | Ground To Fly Ball Ratio | 1.0 |
| 3.9 | Runs Created Per 27 Outs | 2.8 |
| 31.0 | Batter Rating | 32.0 |
| 38.0 | At Bats Per Home Run | 0.0 |
| 0.00 | Stolen Base Percentage | 1.00 |
| 3.45 | Pitches Per Plate Appearance | 3.82 |
| .105 | Isolated Power | .028 |
| 0.13 | Walk To Strikeout Ratio | 0.21 |
| .048 | Walks Per Plate Appearance | .077 |
| -.105 | Secondary Average Minus Batting Average | -.056 |
| 8.0 | Runs Produced | 10.0 |
| 1.0 | Runs Ratio | 1.0 |
| 0.4 | Patience Ratio | 0.3 |
| 0.4 | Balls In Play Average | 0.4 |
| 81.3 | MLB Rating | 76.8 |
| 0.0 | Offensive Wins Above Replacement | 0.0 |
| 0.0 | Wins Above Replacement | 0.0 |
Game Information
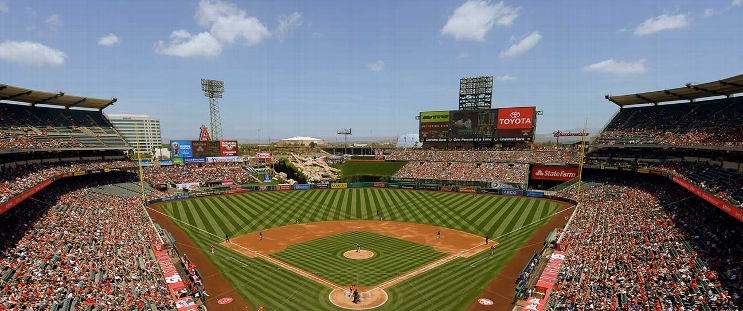
Location: Anaheim, California
Attendance: 34,251 | Capacity:
2026 American League Central Standings
| TEAM | W | L | PCT | GB | STRK |
|---|---|---|---|---|---|
 Cleveland |
- | 77 | L1 | 0.52469134 | 85 |
 Chicago |
1 | 78 | W1 | 0.5185185 | 84 |
| Minnesota |
8 | 85 | W1 | 0.47530866 | 77 |
 Detroit |
9 | 86 | L1 | 0.4691358 | 76 |
 Kansas City |
16 | 93 | W1 | 0.42592594 | 69 |
2026 American League West Standings
| TEAM | W | L | PCT | GB | STRK |
|---|---|---|---|---|---|
 Houston |
- | 81 | W2 | 0.5 | 81 |
 Texas |
1 | 82 | L1 | 0.49382716 | 80 |
 Seattle |
5 | 86 | W2 | 0.4691358 | 76 |
 Athletics |
17 | 98 | L2 | 0.39506173 | 64 |
| Los Angeles |
19 | 100 | L2 | 0.38271606 | 62 |