
New York Yankees at Arizona Diamondbacks
· Major League Baseball
9 - 2

Ben Rice hits 39th homer, Cole becomes winningest No. 1 draft pick as Yanks cruise past D-backs 9-2

After learning three-time AL MVP Aaron Judge was headed back to the injured list with a right calf strain, the Yankees won for the eighth time in 10 games. New York, which has already clinched a playoff spot, is four games behind the Tampa Bay Rays in the AL East with nine games remaining.
The D-backs' have lost three straight and their playoff hopes are in major trouble. They're five games back of the final NL wild card with eight games left.
New York's first five batters reached against D-backs' All-Star left hander Eduardo Rodriguez and George Lombard Jr.'s two-run single made it 5-0. Lombard added a solo homer in the sixth and finished with three RBI.
Cole (9-9) bounced back from a pair of starts that saw him surrender seven homers — the most he's ever given up over a two-game span. He gave up two runs and four hits in six innings, striking out six.
Selected first by Pittsburgh in 2011, Cole won his 162nd game. That is one more than Mike Moore, picked No. 1 by Seattle in 1981.
Rodriguez (15-7) picked a bad time to have arguably his worst start this season, needing 45 pitches to get three outs, his career high for a first inning. He gave up seven runs, five hits and four walks over 5 1/3 innings.
Corbin Carroll hit a two-run homer to cut the deficit to 5-2 in the second. Rice's solo homer in the third pushed the Yankees ahead 6-2.
See AP’s full MLB coverage here
How can I watch New York Yankees vs. Arizona Diamondbacks?
- TV Channel: Yankees at Diamondbacks 2022 MLB Baseball, is broadcasted on MLB.TV.
- Online streaming: Sign up for Fubo.
Scoring Summary
 |
9th Inning | Fernandez struck out swinging. |
|
9th Inning | Carroll flied out to center. |
|
9th Inning | Arenado singled to right, Perdomo to second. |
|
9th Inning | Vargas struck out looking. |
|
9th Inning | Perdomo walked. |
 |
9th Inning | Gil relieved Fulmer |
Statistics
 NYY |
 ARI |
|
|---|---|---|
| 1 | Games Played | 1 |
| 1 | Team Games Played | 1 |
| 0 | Hit By Pitch | 0 |
| 10 | Ground Balls | 6 |
| 7 | Strikeouts | 11 |
| 8 | Runs Batted In | 2 |
| 0 | Sacrifice Hit | 0 |
| 8 | Hits | 7 |
| 0 | Stolen Bases | 0 |
| 6 | Walks | 1 |
| 0 | Catcher Interference | 0 |
| 9 | Runs | 2 |
| 1 | Ground Into Double Play | 0 |
| 0 | Sacrifice Flies | 0 |
| 35 | At Bats | 34 |
| 2 | Home Runs | 1 |
| 0 | Grand Slam Home Runs | 0 |
| 17 | Runners Left On Base | 15 |
| 1 | Triples | 0 |
| 1 | Game Winning RBIs | 0 |
| 0 | Intentional Walks | 0 |
| 0 | Doubles | 1 |
| 18 | Fly Balls | 17 |
| 0 | Caught Stealing | 0 |
| 174 | Pitches | 147 |
| 0 | Games Started | 0 |
| 0 | Pinch At Bats | 2 |
| 0 | Pinch Hits | 0 |
| 0.0 | Player Rating | 0.0 |
| 1 | Is Qualified | 1 |
| 0 | Is Qualified In Steals | 0 |
| 16 | Total Bases | 11 |
| 41 | Plate Appearances | 35 |
| 324.0 | Projected Home Runs | 162.0 |
| 3 | Extra Base Hits | 2 |
| 5.5 | Runs Created | 2.4 |
| .229 | Batting Average | .206 |
| .000 | Pinch Hit Average | .000 |
| .457 | Slugging Percentage | .324 |
| .400 | Secondary Average | .147 |
| .341 | On Base Percentage | .229 |
| .799 | OBP Pct + SLG Pct | .552 |
| 0.6 | Ground To Fly Ball Ratio | 0.4 |
| 5.3 | Runs Created Per 27 Outs | 2.4 |
| 50.5 | Batter Rating | 20.0 |
| 17.5 | At Bats Per Home Run | 34.0 |
| 0.00 | Stolen Base Percentage | 0.00 |
| 4.24 | Pitches Per Plate Appearance | 4.20 |
| .229 | Isolated Power | .118 |
| 0.86 | Walk To Strikeout Ratio | 0.09 |
| .146 | Walks Per Plate Appearance | .029 |
| .171 | Secondary Average Minus Batting Average | -.059 |
| 17.0 | Runs Produced | 4.0 |
| 0.9 | Runs Ratio | 1.0 |
| 0.6 | Patience Ratio | 0.3 |
| 0.2 | Balls In Play Average | 0.3 |
| 93.0 | MLB Rating | 71.8 |
| 0.0 | Offensive Wins Above Replacement | 0.0 |
| 0.0 | Wins Above Replacement | 0.0 |
Game Information
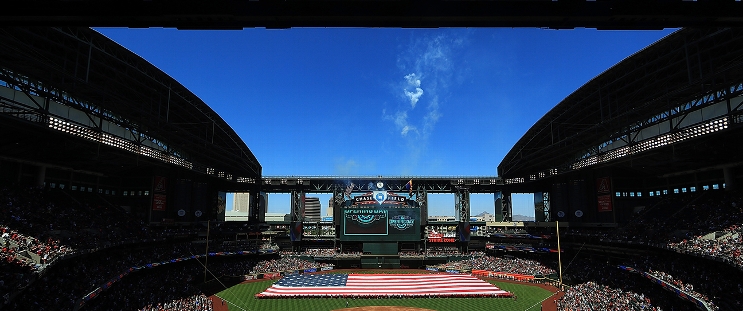
Location: Phoenix, Arizona
Attendance: 41,910 | Capacity:
2026 American League East Standings
| TEAM | W | L | PCT | GB | STRK |
|---|---|---|---|---|---|
 Tampa Bay |
- | 64 | L1 | 0.60493827 | 98 |
| New York |
4.5 | 68 | W1 | 0.57763976 | 93 |
 Boston |
11 | 75 | L1 | 0.537037 | 87 |
 Baltimore |
18.5 | 82 | L1 | 0.49068323 | 79 |
 Toronto |
19 | 83 | W1 | 0.48765433 | 79 |
2026 National League West Standings
| TEAM | W | L | PCT | GB | STRK |
|---|---|---|---|---|---|
 Los Angeles |
- | 62 | W3 | 0.61728394 | 100 |
 San Diego |
9 | 71 | W2 | 0.5617284 | 91 |
| Arizona |
14 | 76 | L2 | 0.5308642 | 86 |
 San Francisco |
35 | 97 | L5 | 0.40123457 | 65 |
 Colorado |
42 | 104 | L1 | 0.3580247 | 58 |