
Toronto Blue Jays at Texas Rangers
· Major League Baseball
7 - 2

Playoff hopeful Blue Jays avoid series sweep with 7-2 win over AL West-leading Texas

Bateman walked twice against Texas starter Jacob deGrom (11-10), scoring on a sacrifice fly by Lukes in the first and a go-ahead RBI single by Kazuma Okamota in the fifth. Bateman had a leadoff double to ignite a four-run seventh, scoring on a single by Lukes.
With six games remaining, the Rangers (78-78) kept a one-game lead in the AL West after Houston (77-79) lost 4-2 at home to NL East champion Atlanta. The Astros own the division tiebreaker.
Toronto (77-79) had the same record as the Astros, and both were 2 1/2 games behind the Chicago White Sox for the third and final wild card.
Spencer Arrighetti (9-9), the second of seven Blue Jays pitchers, got the win despite giving up the only Texas runs over his two innings.
DeGrom, who has been dealing with mild groin tightness, left with the bases loaded in the fifth and the Rangers down 3-2. Left-handed reliever Robert Garcia induced an inning-ending double-play grounder on his first pitch.
DeGrom allowed five hits, walked four and hit another batter. The two-time Cy Young Award winner's two strikeouts put his season total at 196, just short of his fifth career 200-strikeout season.
Lukes had a single and scored on Sean Keys' double in the third for a 2-0 Blue Jays lead. Texas got even on Jake Burger's 27th homer, a two-run shot in the fourth that went 398 feet and deflected off Bateman's extended glove when he leaped at the wall in center field.
See AP’s full MLB coverage here
How can I watch Toronto Blue Jays vs. Texas Rangers?
- TV Channel: Blue Jays at Rangers 2022 MLB Baseball, is broadcasted on MLB.TV.
- Online streaming: Sign up for Fubo.
Scoring Summary
 |
9th Inning | Seager grounded into double play, first to shortstop to pitcher, Langford out at second. |
|
9th Inning | Langford walked, Carter to second. |
|
9th Inning | Carter singled to left. |
|
9th Inning | Jansen grounded out to third. |
 |
9th Inning | Varland relieved Rogers |
|
9th Inning | Springer as designated hitter. |
Statistics
 TOR |
 TEX |
|
|---|---|---|
| 1 | Games Played | 1 |
| 1 | Team Games Played | 1 |
| 1 | Hit By Pitch | 0 |
| 11 | Ground Balls | 11 |
| 5 | Strikeouts | 7 |
| 7 | Runs Batted In | 2 |
| 0 | Sacrifice Hit | 0 |
| 11 | Hits | 8 |
| 0 | Stolen Bases | 0 |
| 6 | Walks | 4 |
| 0 | Catcher Interference | 0 |
| 7 | Runs | 2 |
| 2 | Ground Into Double Play | 1 |
| 1 | Sacrifice Flies | 0 |
| 35 | At Bats | 34 |
| 0 | Home Runs | 1 |
| 0 | Grand Slam Home Runs | 0 |
| 22 | Runners Left On Base | 17 |
| 0 | Triples | 0 |
| 1 | Game Winning RBIs | 0 |
| 0 | Intentional Walks | 0 |
| 4 | Doubles | 0 |
| 20 | Fly Balls | 16 |
| 0 | Caught Stealing | 0 |
| 149 | Pitches | 156 |
| 0 | Games Started | 0 |
| 2 | Pinch At Bats | 1 |
| 0 | Pinch Hits | 1 |
| 0.0 | Player Rating | 0.0 |
| 1 | Is Qualified | 1 |
| 0 | Is Qualified In Steals | 0 |
| 15 | Total Bases | 11 |
| 43 | Plate Appearances | 38 |
| 0.0 | Projected Home Runs | 162.0 |
| 4 | Extra Base Hits | 1 |
| 6.3 | Runs Created | 3.4 |
| .314 | Batting Average | .235 |
| .000 | Pinch Hit Average | 1.000 |
| .429 | Slugging Percentage | .324 |
| .286 | Secondary Average | .206 |
| .419 | On Base Percentage | .316 |
| .847 | OBP Pct + SLG Pct | .639 |
| 0.6 | Ground To Fly Ball Ratio | 0.7 |
| 6.3 | Runs Created Per 27 Outs | 3.4 |
| 47.0 | Batter Rating | 19.0 |
| 0.0 | At Bats Per Home Run | 34.0 |
| 0.00 | Stolen Base Percentage | 0.00 |
| 3.47 | Pitches Per Plate Appearance | 4.11 |
| .114 | Isolated Power | .088 |
| 1.20 | Walk To Strikeout Ratio | 0.57 |
| .140 | Walks Per Plate Appearance | .105 |
| -.029 | Secondary Average Minus Batting Average | -.029 |
| 14.0 | Runs Produced | 4.0 |
| 1.0 | Runs Ratio | 1.0 |
| 0.5 | Patience Ratio | 0.4 |
| 0.4 | Balls In Play Average | 0.3 |
| 93.8 | MLB Rating | 74.8 |
| 0.0 | Offensive Wins Above Replacement | 0.0 |
| 0.0 | Wins Above Replacement | 0.0 |
Game Information
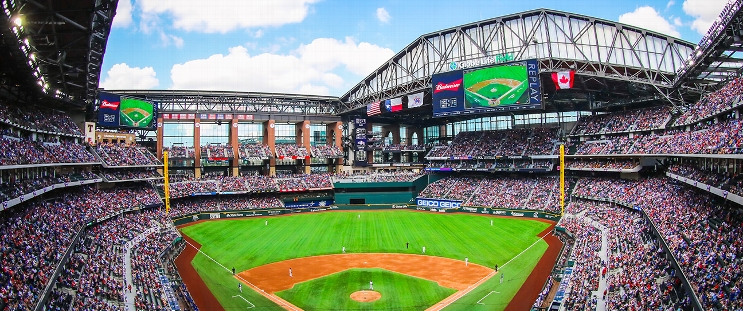
Location: Arlington, Texas
Attendance: 33,694 | Capacity:
2026 American League East Standings
| TEAM | W | L | PCT | GB | STRK |
|---|---|---|---|---|---|
 Tampa Bay |
- | 64 | L1 | 0.60493827 | 98 |
 New York |
4.5 | 68 | W1 | 0.57763976 | 93 |
 Boston |
11 | 75 | L1 | 0.537037 | 87 |
 Baltimore |
18.5 | 82 | L1 | 0.49068323 | 79 |
| Toronto |
19 | 83 | W1 | 0.48765433 | 79 |
2026 American League West Standings
| TEAM | W | L | PCT | GB | STRK |
|---|---|---|---|---|---|
 Houston |
- | 81 | W2 | 0.5 | 81 |
| Texas |
1 | 82 | L1 | 0.49382716 | 80 |
 Seattle |
5 | 86 | W2 | 0.4691358 | 76 |
 Athletics |
17 | 98 | L2 | 0.39506173 | 64 |
 Los Angeles |
19 | 100 | L2 | 0.38271606 | 62 |