
Washington Nationals at St. Louis Cardinals
· Major League Baseball
3 - 5

Bernal, Herrera homer in eighth inning to help Cardinals beat Nationals 5-3

Bernal hit his fifth homer of the season off Yovanny Cruz (0-2) after Erik Tolman walked Jordan Walker with two outs in the eighth inning.
Herrera hit his second homer of the game and 18th of the season to tie the game at 3-all after hitting a solo shot in the first inning.
It was Herrera's third career multi-homer game and second this season after going deep twice on June 13 at Minnesota.
Luis Gastelum (5-3) pitched a scoreless eighth inning for St. Louis, and Riley O’Brien pitched a perfect ninth to earn his National League-leading 38th save.
Cardinals starter Quinn Mathews allowed three runs on seven hits and two walks in a career-high seven innings.
Jake Irvin allowed two runs on three hits and had eight strikeouts in 5 1/3 innings for the Nationals.
Brady House singled to right field to leadoff the sixth inning, and Abrams hit his 37th homer of the season to right field to put Washington ahead 3-2. He has 99 RBI on the season.
The Nationals had a chance to add on when Daylen Lile hit a double down the right field line, but Jordan Walker delivered a perfect throw to third base to retire Lile on a call that was confirmed after Washington manager Blake Butera challenged.
Cardinals: Open a three-game series in Pittsburgh Monday night where RHP Andre Pallante (12-7, 3.70) will face Pirates RHP Jared Jones (4-6, 4.17)
See AP’s full MLB coverage here
How can I watch Washington Nationals vs. St. Louis Cardinals?
- TV Channel: Nationals at Cardinals 2022 MLB Baseball, is broadcasted on MLB.TV.
- Online streaming: Sign up for Fubo.
Scoring Summary
 |
9th Inning | Ruiz grounded out to first. |
|
9th Inning | Ruiz hit for Ford |
|
9th Inning | Lile popped out to shortstop. |
|
9th Inning | Crews lined out to left. |
 |
9th Inning | O'Brien relieved Gastelum |
|
9th Inning | Scott II in left field. |
Statistics
 WSH |
 STL |
|
|---|---|---|
| 1 | Games Played | 1 |
| 1 | Team Games Played | 1 |
| 0 | Hit By Pitch | 0 |
| 9 | Ground Balls | 10 |
| 5 | Strikeouts | 8 |
| 3 | Runs Batted In | 5 |
| 0 | Sacrifice Hit | 0 |
| 7 | Hits | 6 |
| 1 | Stolen Bases | 0 |
| 2 | Walks | 2 |
| 0 | Catcher Interference | 0 |
| 3 | Runs | 5 |
| 0 | Ground Into Double Play | 0 |
| 1 | Sacrifice Flies | 0 |
| 31 | At Bats | 31 |
| 1 | Home Runs | 3 |
| 0 | Grand Slam Home Runs | 0 |
| 6 | Runners Left On Base | 9 |
| 0 | Triples | 0 |
| 0 | Game Winning RBIs | 1 |
| 0 | Intentional Walks | 0 |
| 1 | Doubles | 1 |
| 18 | Fly Balls | 13 |
| 1 | Caught Stealing | 0 |
| 114 | Pitches | 155 |
| 0 | Games Started | 0 |
| 3 | Pinch At Bats | 0 |
| 0 | Pinch Hits | 0 |
| 0.0 | Player Rating | 0.0 |
| 1 | Is Qualified | 1 |
| 1 | Is Qualified In Steals | 0 |
| 11 | Total Bases | 16 |
| 34 | Plate Appearances | 33 |
| 162.0 | Projected Home Runs | 486.0 |
| 2 | Extra Base Hits | 4 |
| 2.9 | Runs Created | 4.1 |
| .226 | Batting Average | .194 |
| .000 | Pinch Hit Average | .000 |
| .355 | Slugging Percentage | .516 |
| .194 | Secondary Average | .387 |
| .265 | On Base Percentage | .242 |
| .620 | OBP Pct + SLG Pct | .759 |
| 0.5 | Ground To Fly Ball Ratio | 0.8 |
| 3.1 | Runs Created Per 27 Outs | 4.5 |
| 25.0 | Batter Rating | 37.0 |
| 31.0 | At Bats Per Home Run | 10.3 |
| 0.50 | Stolen Base Percentage | 0.00 |
| 3.35 | Pitches Per Plate Appearance | 4.70 |
| .129 | Isolated Power | .323 |
| 0.40 | Walk To Strikeout Ratio | 0.25 |
| .059 | Walks Per Plate Appearance | .061 |
| -.032 | Secondary Average Minus Batting Average | .194 |
| 6.0 | Runs Produced | 10.0 |
| 1.0 | Runs Ratio | 1.0 |
| 0.4 | Patience Ratio | 0.6 |
| 0.2 | Balls In Play Average | 0.2 |
| 76.5 | MLB Rating | 83.3 |
| 0.0 | Offensive Wins Above Replacement | 0.0 |
| 0.0 | Wins Above Replacement | 0.0 |
Game Information
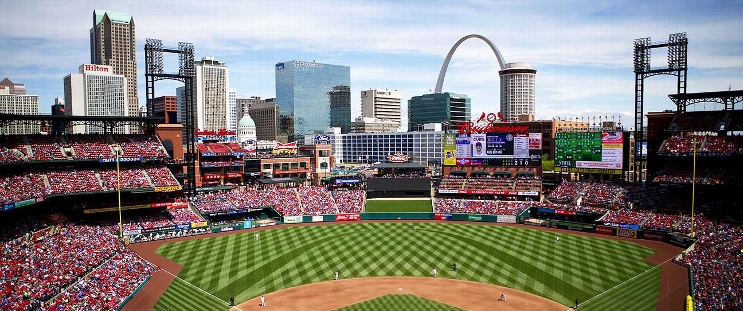
Location: St. Louis, Missouri
Attendance: 27,814 | Capacity:
2026 National League East Standings
| TEAM | W | L | PCT | GB | STRK |
|---|---|---|---|---|---|
 Atlanta |
- | 68 | L1 | 0.5802469 | 94 |
 Philadelphia |
6 | 74 | W1 | 0.54320985 | 88 |
 Miami |
14 | 82 | W1 | 0.49382716 | 80 |
| Washington |
17 | 85 | W1 | 0.47530866 | 77 |
 New York |
20 | 88 | L1 | 0.45679012 | 74 |
2026 National League Central Standings
| TEAM | W | L | PCT | GB | STRK |
|---|---|---|---|---|---|
 Milwaukee |
- | 59 | W5 | 0.63580245 | 103 |
 Chicago |
14 | 73 | W1 | 0.5493827 | 89 |
 Pittsburgh |
21 | 80 | W1 | 0.50617284 | 82 |
| St. Louis |
26 | 85 | L4 | 0.47530866 | 77 |
 Cincinnati |
28 | 87 | L1 | 0.46296296 | 75 |