
New York Yankees at Arizona Diamondbacks
· Major League Baseball
4 - 8

Arenado hits grand slam in the Diamondbacks' 8-4 victory over the Yankees

Arenado connected off reliever Brent Headrick (7-4) in the fifth inning. The Diamondbacks loaded the bases against Yankee starter Will Warren when Headrick entered. He struck out Geraldo Perdomo for the second out but walked Corbin Carroll to force in a run before Arenado homered on a 2-1 pitch. He tied Houston’s Yordan Alvarez for the major league lead this season, and it was Arenado’s ninth career slam.
The Diamondbacks had their MLB-best 47th comeback win of the season and kept pace with Philadelphia in the chase for the National League’s final wild-card berth, but trail the Phillies by four games with six to play.
New York still has a slim chance to win the American League East, but must win out and get help. The Yankees open a four-game series Tuesday against the division-leading Rays in New York.
Perdomo had a run-scoring single in the first and an RBI triple in the seventh.
Heliot Ramos, George Lombard Jr. and Spencer Jones homered for New York, all in the third inning, off Arizona starter Corbin Burnes.
Justin Martinez (3-0) was one of five Arizona relievers to hold the Yankees to three hits in the final 6 1/3 innings.
The Yankees finished their road season 47-34 (.580), second only to the Dodgers (46-32, .590). Arizona finished its home season 45-36 (.556), its best mark since 2017 (52-29, .642).
Diamondbacks: Off Monday. RHP Michael Soroka (8-5, 3.45) was scheduled to start Tuesday at Colorado against LHP Kyle Freeland (4-10, 6.38).
See AP’s full MLB coverage here
How can I watch New York Yankees vs. Arizona Diamondbacks?
- TV Channel: Yankees at Diamondbacks 2022 MLB Baseball, is broadcasted on MLB.TV.
- Online streaming: Sign up for Fubo.
Scoring Summary
 |
9th Inning | Caballero grounded into double play, pitcher to second to first, Wells out at second. |
|
9th Inning | Wells singled to right. |
|
9th Inning | Volpe grounded out to shortstop. |
 |
8th Inning | Lawlar struck out swinging. |
|
8th Inning | Tawa popped out to shortstop. |
|
8th Inning | Vargas grounded out to second. |
Statistics
 NYY |
 ARI |
|
|---|---|---|
| 1 | Games Played | 1 |
| 1 | Team Games Played | 1 |
| 0 | Hit By Pitch | 0 |
| 11 | Ground Balls | 15 |
| 8 | Strikeouts | 6 |
| 4 | Runs Batted In | 8 |
| 0 | Sacrifice Hit | 0 |
| 8 | Hits | 11 |
| 0 | Stolen Bases | 0 |
| 2 | Walks | 4 |
| 0 | Catcher Interference | 0 |
| 4 | Runs | 8 |
| 1 | Ground Into Double Play | 3 |
| 0 | Sacrifice Flies | 0 |
| 34 | At Bats | 33 |
| 3 | Home Runs | 1 |
| 0 | Grand Slam Home Runs | 1 |
| 13 | Runners Left On Base | 14 |
| 0 | Triples | 1 |
| 0 | Game Winning RBIs | 1 |
| 0 | Intentional Walks | 0 |
| 0 | Doubles | 1 |
| 15 | Fly Balls | 12 |
| 0 | Caught Stealing | 0 |
| 151 | Pitches | 139 |
| 0 | Games Started | 0 |
| 0 | Pinch At Bats | 1 |
| 0 | Pinch Hits | 0 |
| 0.0 | Player Rating | 0.0 |
| 1 | Is Qualified | 1 |
| 0 | Is Qualified In Steals | 0 |
| 17 | Total Bases | 17 |
| 36 | Plate Appearances | 37 |
| 486.0 | Projected Home Runs | 162.0 |
| 3 | Extra Base Hits | 3 |
| 4.5 | Runs Created | 5.7 |
| .235 | Batting Average | .333 |
| .000 | Pinch Hit Average | .000 |
| .500 | Slugging Percentage | .515 |
| .324 | Secondary Average | .303 |
| .278 | On Base Percentage | .405 |
| .778 | OBP Pct + SLG Pct | .921 |
| 0.7 | Ground To Fly Ball Ratio | 1.3 |
| 4.5 | Runs Created Per 27 Outs | 6.2 |
| 33.0 | Batter Rating | 50.5 |
| 11.3 | At Bats Per Home Run | 33.0 |
| 0.00 | Stolen Base Percentage | 0.00 |
| 4.19 | Pitches Per Plate Appearance | 3.76 |
| .265 | Isolated Power | .182 |
| 0.25 | Walk To Strikeout Ratio | 0.67 |
| .056 | Walks Per Plate Appearance | .108 |
| .088 | Secondary Average Minus Batting Average | -.030 |
| 8.0 | Runs Produced | 16.0 |
| 1.0 | Runs Ratio | 1.0 |
| 0.5 | Patience Ratio | 0.6 |
| 0.2 | Balls In Play Average | 0.4 |
| 84.0 | MLB Rating | 97.0 |
| 0.0 | Offensive Wins Above Replacement | 0.0 |
| 0.0 | Wins Above Replacement | 0.0 |
Game Information
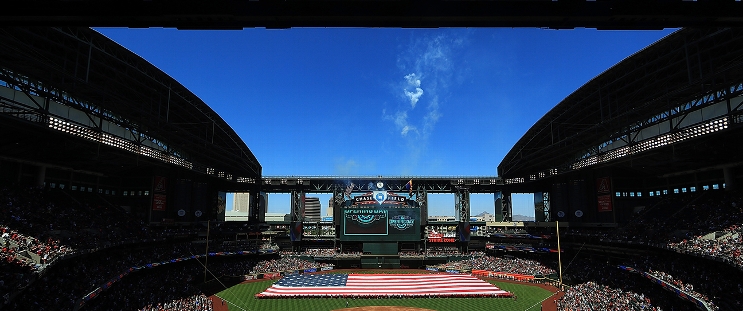
Location: Phoenix, Arizona
Attendance: 37,755 | Capacity:
2026 American League East Standings
| TEAM | W | L | PCT | GB | STRK |
|---|---|---|---|---|---|
 Tampa Bay |
- | 64 | L1 | 0.60493827 | 98 |
| New York |
4.5 | 68 | W1 | 0.57763976 | 93 |
 Boston |
11 | 75 | L1 | 0.537037 | 87 |
 Baltimore |
18.5 | 82 | L1 | 0.49068323 | 79 |
 Toronto |
19 | 83 | W1 | 0.48765433 | 79 |
2026 National League West Standings
| TEAM | W | L | PCT | GB | STRK |
|---|---|---|---|---|---|
 Los Angeles |
- | 62 | W3 | 0.61728394 | 100 |
 San Diego |
9 | 71 | W2 | 0.5617284 | 91 |
| Arizona |
14 | 76 | L2 | 0.5308642 | 86 |
 San Francisco |
35 | 97 | L5 | 0.40123457 | 65 |
 Colorado |
42 | 104 | L1 | 0.3580247 | 58 |