
Minnesota Twins at San Francisco Giants
· Major League Baseball
2 - 5

Drew Gilbert's homer and 2-run single lead Giants past Twins 5-2 to end 3-game losing streak

Brett Harris singled in a pair of runs for San Francisco in the first inning and Gilbert did the same in the second before leading off the fifth with his 11th homer.
Brooks Lee homered to begin the fourth against Giants starter Blade Tidwell, who exited after one more batter because of elbow discomfort. He will undergo tests Tuesday.
Tidwell was coming off his first win with the Giants and second of his career last time out at St. Louis.
Tristan Beck (1-0) relieved and pitched 2 2/3 scoreless innings for the win. Trent Harris worked the ninth for his second save.
Bo Davidson had his first career hit and stolen base in the first — becoming the first Giants player to get a hit and steal a base in his major league debut since Red Tramback on Sept. 15, 1940.
The Giants opened their season-ending homestand, which concludes against the rival Los Angeles Dodgers this weekend, with their third victory in 10 games. They were swept by the two-time defending World Series champion Dodgers last weekend in Los Angeles.
Emmanuel Rodríguez homered in the eighth for the Twins.
Minnesota right-hander Zebby Matthews (9-11) struck out nine — his second-most this season behind 10 on July 31 at Seattle — and didn't walk a batter. He allowed five runs and eight hits over five innings.
See AP’s full MLB coverage here
How can I watch Minnesota Twins vs. San Francisco Giants?
- TV Channel: Twins at Giants 2022 MLB Baseball, is broadcasted on MLB.TV.
- Online streaming: Sign up for Fubo.
Scoring Summary
 |
9th Inning | Jeffers fouled out to third. |
|
9th Inning | Clemens struck out swinging. |
|
9th Inning | Lee flied out to center. |
 |
9th Inning | T. Harris relieved Foley |
|
9th Inning | Hill in left field. |
|
9th Inning | Whitcomb at third base. |
Statistics
 MIN |
 SF |
|
|---|---|---|
| 1 | Games Played | 1 |
| 1 | Team Games Played | 1 |
| 0 | Hit By Pitch | 0 |
| 11 | Ground Balls | 10 |
| 8 | Strikeouts | 13 |
| 2 | Runs Batted In | 5 |
| 0 | Sacrifice Hit | 0 |
| 4 | Hits | 10 |
| 0 | Stolen Bases | 1 |
| 1 | Walks | 0 |
| 0 | Catcher Interference | 0 |
| 2 | Runs | 5 |
| 1 | Ground Into Double Play | 1 |
| 0 | Sacrifice Flies | 0 |
| 31 | At Bats | 33 |
| 2 | Home Runs | 1 |
| 0 | Grand Slam Home Runs | 0 |
| 5 | Runners Left On Base | 14 |
| 0 | Triples | 0 |
| 0 | Game Winning RBIs | 1 |
| 0 | Intentional Walks | 0 |
| 0 | Doubles | 2 |
| 12 | Fly Balls | 10 |
| 0 | Caught Stealing | 0 |
| 134 | Pitches | 145 |
| 0 | Games Started | 0 |
| 0 | Pinch At Bats | 1 |
| 0 | Pinch Hits | 1 |
| 0.0 | Player Rating | 0.0 |
| 1 | Is Qualified | 1 |
| 0 | Is Qualified In Steals | 1 |
| 10 | Total Bases | 15 |
| 32 | Plate Appearances | 33 |
| 324.0 | Projected Home Runs | 162.0 |
| 2 | Extra Base Hits | 3 |
| 0.9 | Runs Created | 4.2 |
| .129 | Batting Average | .303 |
| .000 | Pinch Hit Average | 1.000 |
| .323 | Slugging Percentage | .455 |
| .226 | Secondary Average | .182 |
| .156 | On Base Percentage | .303 |
| .479 | OBP Pct + SLG Pct | .758 |
| 0.9 | Ground To Fly Ball Ratio | 1.0 |
| 0.9 | Runs Created Per 27 Outs | 4.8 |
| 18.0 | Batter Rating | 38.0 |
| 15.5 | At Bats Per Home Run | 33.0 |
| 0.00 | Stolen Base Percentage | 1.00 |
| 4.19 | Pitches Per Plate Appearance | 4.39 |
| .194 | Isolated Power | .152 |
| 0.13 | Walk To Strikeout Ratio | 0.00 |
| .031 | Walks Per Plate Appearance | .000 |
| .097 | Secondary Average Minus Batting Average | -.121 |
| 4.0 | Runs Produced | 10.0 |
| 1.0 | Runs Ratio | 1.0 |
| 0.3 | Patience Ratio | 0.5 |
| 0.1 | Balls In Play Average | 0.5 |
| 68.5 | MLB Rating | 85.3 |
| 0.0 | Offensive Wins Above Replacement | 0.0 |
| 0.0 | Wins Above Replacement | 0.0 |
Game Information
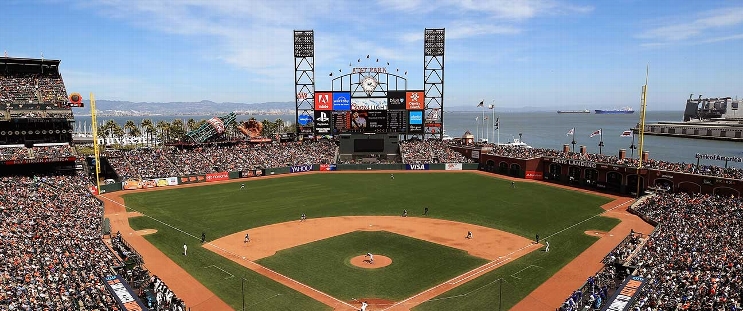
Location: San Francisco, California
Attendance: 27,466 | Capacity:
2026 American League Central Standings
| TEAM | W | L | PCT | GB | STRK |
|---|---|---|---|---|---|
 Cleveland |
- | 77 | L1 | 0.52469134 | 85 |
 Chicago |
1 | 78 | W1 | 0.5185185 | 84 |
| Minnesota |
8 | 85 | W1 | 0.47530866 | 77 |
 Detroit |
9 | 86 | L1 | 0.4691358 | 76 |
 Kansas City |
16 | 93 | W1 | 0.42592594 | 69 |
2026 National League West Standings
| TEAM | W | L | PCT | GB | STRK |
|---|---|---|---|---|---|
 Los Angeles |
- | 62 | W3 | 0.61728394 | 100 |
 San Diego |
9 | 71 | W2 | 0.5617284 | 91 |
 Arizona |
14 | 76 | L2 | 0.5308642 | 86 |
| San Francisco |
35 | 97 | L5 | 0.40123457 | 65 |
 Colorado |
42 | 104 | L1 | 0.3580247 | 58 |