
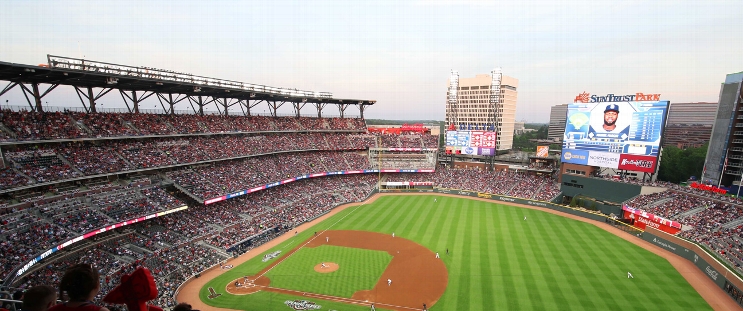
Cincinnati Reds at Atlanta Braves
· Major League Baseball
2 - 3

Chris Sale fans 10, reaches 200 strikeouts for the season as Braves edge Reds 3-2

Matt Olson and Austin Riley hit solo homers for the Braves. Brent Suter (3-2) worked a scoreless 10th inning and earned the win.
Sale went 5 2/3 innings and was removed after recording his third strikeout of the game of Reds rookie Sal Stewart. The 37-year-old left-hander has reached 200 strikeouts nine times, which is the most of any pitcher since 2013. In his final start before the postseason, he allowed one run on four hits. Sale hit at least 99 mph on the radar gun on 12 of his 97 pitches.
Olson’s home run was his 41st of the season and tied the game at 1 in the sixth. Riley's homer tied the game at 2 in the seventh. Dubón was 2 for 4 with a walk and extended his hitting streak to 10 games.
Reds right fielder Juan Brito led off the game with a home run to center field off Sale. He went 2 for 4, including his third homer of the season.
Braves reliever Robert Suarez pitched for the first time since June 19 after being sidelined due to elbow inflammation. He pitched the seventh inning and gave up a leadoff triple to Matt McLain and a sacrifice fly to Will Banfield that gave the Reds a 2-1 lead. He threw 13 pitches.
Braves right fielder Ronald Acuña Jr. sat out after suffering a bone bruise when he fouled a ball off his shin in Tuesday's 4-0 loss to the Reds. Braves manager Walt Weiss said Acuña was asking to play and felt he could play right field Wednesday, but the Braves decided to be cautious with a postseason berth clinched.
See AP’s full MLB coverage here
How can I watch Cincinnati Reds vs. Atlanta Braves?
- TV Channel: Reds at Braves 2022 MLB Baseball, is broadcasted on MLB.TV.
- Online streaming: Sign up for Fubo.
Scoring Summary
 |
10th Inning | Dubón reached on infield single to pitcher, Keirsey Jr. scored, Baldwin to second. |
|
10th Inning | Baldwin hit by pitch. |
|
10th Inning | Kim hit sacrifice bunt to first, Keirsey Jr. to third. |
 |
10th Inning | Mey relieved Johnson |
|
10th Inning | Bleday in left field. |
|
10th Inning | Stephenson catching. |
Statistics
 CIN |
 ATL |
|
|---|---|---|
| 1 | Games Played | 1 |
| 1 | Team Games Played | 1 |
| 1 | Hit By Pitch | 2 |
| 5 | Ground Balls | 11 |
| 15 | Strikeouts | 8 |
| 2 | Runs Batted In | 3 |
| 0 | Sacrifice Hit | 1 |
| 5 | Hits | 7 |
| 1 | Stolen Bases | 0 |
| 1 | Walks | 2 |
| 0 | Catcher Interference | 0 |
| 2 | Runs | 3 |
| 0 | Ground Into Double Play | 1 |
| 1 | Sacrifice Flies | 0 |
| 33 | At Bats | 33 |
| 1 | Home Runs | 2 |
| 0 | Grand Slam Home Runs | 0 |
| 9 | Runners Left On Base | 9 |
| 1 | Triples | 0 |
| 0 | Game Winning RBIs | 1 |
| 0 | Intentional Walks | 0 |
| 1 | Doubles | 1 |
| 14 | Fly Balls | 15 |
| 1 | Caught Stealing | 0 |
| 161 | Pitches | 141 |
| 0 | Games Started | 0 |
| 2 | Pinch At Bats | 2 |
| 0 | Pinch Hits | 0 |
| 0.0 | Player Rating | 0.0 |
| 1 | Is Qualified | 1 |
| 1 | Is Qualified In Steals | 0 |
| 11 | Total Bases | 14 |
| 36 | Plate Appearances | 38 |
| 162.0 | Projected Home Runs | 324.0 |
| 3 | Extra Base Hits | 3 |
| 1.9 | Runs Created | 4.1 |
| .152 | Batting Average | .212 |
| .000 | Pinch Hit Average | .000 |
| .333 | Slugging Percentage | .424 |
| .212 | Secondary Average | .273 |
| .194 | On Base Percentage | .297 |
| .528 | OBP Pct + SLG Pct | .722 |
| 0.4 | Ground To Fly Ball Ratio | 0.7 |
| 1.7 | Runs Created Per 27 Outs | 3.9 |
| 21.5 | Batter Rating | 27.0 |
| 33.0 | At Bats Per Home Run | 16.5 |
| 0.50 | Stolen Base Percentage | 0.00 |
| 4.47 | Pitches Per Plate Appearance | 3.71 |
| .182 | Isolated Power | .212 |
| 0.07 | Walk To Strikeout Ratio | 0.25 |
| .028 | Walks Per Plate Appearance | .053 |
| .061 | Secondary Average Minus Batting Average | .061 |
| 4.0 | Runs Produced | 6.0 |
| 1.0 | Runs Ratio | 1.0 |
| 0.4 | Patience Ratio | 0.5 |
| 0.2 | Balls In Play Average | 0.2 |
| 69.0 | MLB Rating | 78.8 |
| 0.0 | Offensive Wins Above Replacement | 0.0 |
| 0.0 | Wins Above Replacement | 0.0 |
Game Information
Location: Atlanta, Georgia
Attendance: 39,680 | Capacity:
2026 National League Central Standings
| TEAM | W | L | PCT | GB | STRK |
|---|---|---|---|---|---|
 Milwaukee |
- | 59 | W5 | 0.63580245 | 103 |
 Chicago |
14 | 73 | W1 | 0.5493827 | 89 |
 Pittsburgh |
21 | 80 | W1 | 0.50617284 | 82 |
 St. Louis |
26 | 85 | L4 | 0.47530866 | 77 |
| Cincinnati |
28 | 87 | L1 | 0.46296296 | 75 |
2026 National League East Standings
| TEAM | W | L | PCT | GB | STRK |
|---|---|---|---|---|---|
| Atlanta |
- | 68 | L1 | 0.5802469 | 94 |
 Philadelphia |
6 | 74 | W1 | 0.54320985 | 88 |
 Miami |
14 | 82 | W1 | 0.49382716 | 80 |
 Washington |
17 | 85 | W1 | 0.47530866 | 77 |
 New York |
20 | 88 | L1 | 0.45679012 | 74 |