
Washington Nationals at Detroit Tigers
· Major League Baseball
4 - 2

Yohandry Morales homers, Nationals bullpen hangs on for a 4-2 win over the Tigers

Washington has won eight of its last 11 games. Detroit has lost six of eight.
Will Dion (2-2) picked up the win despite giving up three hits and one run in two innings of relief. Yovanny Cruz got the final four outs for his first save.
Framber Valdez (10-12) took the loss, allowing two runs in 5 1/3 innings.
The Nationals ended the scoreless tie with three straight singles to start the sixth. Base hits by Andres Chaparro and Brady House put runners on first and second, and CJ Abrams made it 1-0 with a line drive to right.
Tyler Kinley relieved Valdez, who gave up a two-run home run to Morales to put the Nationals ahead 3-0. Morales also had a two-run homer on Monday night.
Detroit's Ben Malgeri led off the bottom of the inning with his fifth home run, a solo shot off Dion, to make it a two-run game.
Nasim Nunez made it 4-1 in the seventh. He blooped a single to second, stole second and third and scored on a James Wood groundout. The two steals gave him 49 for the season, breaking Abrams' Nationals record of 47, set in 2023. Ron LeFlore has the overall franchise record with 97 in 1980.
Malgeri made it 4-2 with an RBI single with two out in the ninth, but Cruz retired Riley Greene to end the game.
Tigers: Off Thursday before the Pittsburgh Pirates come to Comerica Park to finish the season. RHP Jackson Jobe (2-3, 3,98) will start the opener for Detroit.
See AP’s full MLB coverage here
How can I watch Washington Nationals vs. Detroit Tigers?
- TV Channel: Nationals at Tigers 2022 MLB Baseball, is broadcasted on ESPN Unlmtd.
- Online streaming: Sign up for Fubo.
Scoring Summary
 |
9th Inning | Greene flied out to left. |
|
9th Inning | Malgeri singled to right, Jung scored, McGonigle to third. |
|
9th Inning | Lee popped out to catcher. |
|
9th Inning | McGonigle singled to center, Jung to second. |
|
9th Inning | Jung singled to right. |
|
9th Inning | Callahan struck out swinging. |
Statistics
 WSH |
 DET |
|
|---|---|---|
| 1 | Games Played | 1 |
| 1 | Team Games Played | 1 |
| 0 | Hit By Pitch | 0 |
| 10 | Ground Balls | 9 |
| 8 | Strikeouts | 9 |
| 4 | Runs Batted In | 2 |
| 0 | Sacrifice Hit | 1 |
| 6 | Hits | 8 |
| 2 | Stolen Bases | 1 |
| 4 | Walks | 6 |
| 0 | Catcher Interference | 0 |
| 4 | Runs | 2 |
| 1 | Ground Into Double Play | 1 |
| 0 | Sacrifice Flies | 0 |
| 31 | At Bats | 33 |
| 1 | Home Runs | 1 |
| 0 | Grand Slam Home Runs | 0 |
| 7 | Runners Left On Base | 21 |
| 0 | Triples | 0 |
| 1 | Game Winning RBIs | 0 |
| 0 | Intentional Walks | 0 |
| 0 | Doubles | 2 |
| 13 | Fly Balls | 16 |
| 0 | Caught Stealing | 0 |
| 137 | Pitches | 155 |
| 0 | Games Started | 0 |
| 1 | Pinch At Bats | 2 |
| 0 | Pinch Hits | 0 |
| 0.0 | Player Rating | 0.0 |
| 1 | Is Qualified | 1 |
| 1 | Is Qualified In Steals | 1 |
| 9 | Total Bases | 13 |
| 35 | Plate Appearances | 40 |
| 162.0 | Projected Home Runs | 162.0 |
| 1 | Extra Base Hits | 3 |
| 2.8 | Runs Created | 5.0 |
| .194 | Batting Average | .242 |
| .000 | Pinch Hit Average | .000 |
| .290 | Slugging Percentage | .394 |
| .290 | Secondary Average | .364 |
| .286 | On Base Percentage | .359 |
| .576 | OBP Pct + SLG Pct | .753 |
| 0.8 | Ground To Fly Ball Ratio | 0.6 |
| 2.9 | Runs Created Per 27 Outs | 5.0 |
| 27.0 | Batter Rating | 24.0 |
| 31.0 | At Bats Per Home Run | 33.0 |
| 1.00 | Stolen Base Percentage | 1.00 |
| 3.91 | Pitches Per Plate Appearance | 3.88 |
| .097 | Isolated Power | .152 |
| 0.50 | Walk To Strikeout Ratio | 0.67 |
| .114 | Walks Per Plate Appearance | .150 |
| .097 | Secondary Average Minus Batting Average | .121 |
| 8.0 | Runs Produced | 4.0 |
| 1.0 | Runs Ratio | 1.0 |
| 0.4 | Patience Ratio | 0.5 |
| 0.2 | Balls In Play Average | 0.3 |
| 75.3 | MLB Rating | 77.5 |
| 0.0 | Offensive Wins Above Replacement | 0.0 |
| 0.0 | Wins Above Replacement | 0.0 |
Game Information
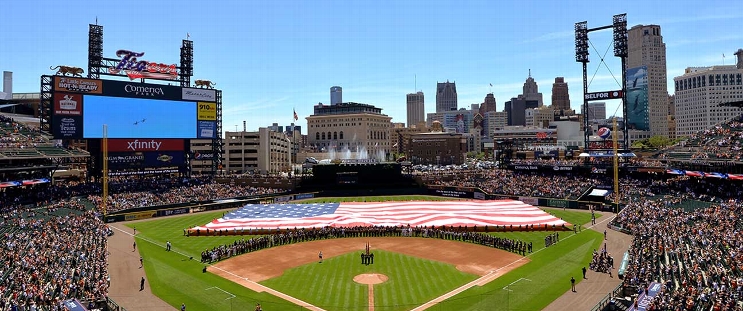
Location: Detroit, Michigan
Attendance: 21,373 | Capacity:
2026 National League East Standings
| TEAM | W | L | PCT | GB | STRK |
|---|---|---|---|---|---|
 Atlanta |
- | 68 | L1 | 0.5802469 | 94 |
 Philadelphia |
6 | 74 | W1 | 0.54320985 | 88 |
 Miami |
14 | 82 | W1 | 0.49382716 | 80 |
| Washington |
17 | 85 | W1 | 0.47530866 | 77 |
 New York |
20 | 88 | L1 | 0.45679012 | 74 |
2026 American League Central Standings
| TEAM | W | L | PCT | GB | STRK |
|---|---|---|---|---|---|
 Cleveland |
- | 77 | L1 | 0.52469134 | 85 |
 Chicago |
1 | 78 | W1 | 0.5185185 | 84 |
 Minnesota |
8 | 85 | W1 | 0.47530866 | 77 |
| Detroit |
9 | 86 | L1 | 0.4691358 | 76 |
 Kansas City |
16 | 93 | W1 | 0.42592594 | 69 |