
Miami Marlins at Chicago Cubs
· Major League Baseball
3 - 2

Marlins prevent Cubs from clinching a playoff spot again with a 3-2 victory

Dansby Swanson drove in both runs for the Cubs, who needed a win or an Arizona loss at Colorado to secure a National League wild-card spot. The Diamondbacks beat the Rockies 5-3.
Chicago is tied with Philadelphia at 87-71 for the second of three NL wild cards — one game behind San Diego with four to play. None of them have wrapped up a trip to the postseason.
The Padres won 5-1 at Dodger Stadium, hours after the Phillies lost 4-1 at home to NL Central champion Milwaukee.
Joe Mack’s groundout brought home Agustín Ramírez with the go-ahead run in the seventh inning and the Marlins retired the next nine Chicago batters to win their second straight game after dropping three in San Diego.
Stowers hit his 21st homer, a two-run shot, off Kevin Gausman in the sixth to break a scoreless tie. The Cubs evened things in the bottom of the inning when Swanson hit a broken-bat single into left field to bring home a pair of runs.
Cade Gibson (6-2), the second of four Miami relievers, struck out two in the seventh and Sandy Alcantara worked the ninth for his second save.
Ryan Rolison (9-2) took the loss.
Gausman struck out seven and allowed two runs, six hits and a walk in the first 5 2/3 innings. Miami’s Ryan Gusto allowed six hits and two walks while striking out five in 5 1/3 innings.
Chicago’s Pete Crow-Armstrong needed a stolen base to become the seventh player to join the 40-40 club but went 0 for 3 with a walk and remained at 45 home runs and 39 steals.
See AP’s full MLB coverage here
How can I watch Miami Marlins vs. Chicago Cubs?
- TV Channel: Marlins at Cubs 2022 MLB Baseball, is broadcasted on MLB.TV.
- Online streaming: Sign up for Fubo.
Scoring Summary
 |
9th Inning | Kelly grounded into double play, shortstop to second to first, Ramirez out at second. |
|
9th Inning | Kelly hit for Amaya |
|
9th Inning | Swanson flied out to left. |
|
9th Inning | Ramirez singled to left. |
 |
9th Inning | Alcantara relieved Faucher |
|
9th Inning | Serna picked off first. |
Statistics
 MIA |
 CHC |
|
|---|---|---|
| 1 | Games Played | 1 |
| 1 | Team Games Played | 1 |
| 0 | Hit By Pitch | 1 |
| 15 | Ground Balls | 11 |
| 10 | Strikeouts | 9 |
| 3 | Runs Batted In | 2 |
| 0 | Sacrifice Hit | 0 |
| 10 | Hits | 8 |
| 1 | Stolen Bases | 0 |
| 2 | Walks | 2 |
| 0 | Catcher Interference | 0 |
| 3 | Runs | 2 |
| 0 | Ground Into Double Play | 1 |
| 0 | Sacrifice Flies | 0 |
| 34 | At Bats | 33 |
| 1 | Home Runs | 0 |
| 0 | Grand Slam Home Runs | 0 |
| 14 | Runners Left On Base | 17 |
| 0 | Triples | 0 |
| 1 | Game Winning RBIs | 0 |
| 0 | Intentional Walks | 0 |
| 1 | Doubles | 2 |
| 9 | Fly Balls | 13 |
| 1 | Caught Stealing | 1 |
| 166 | Pitches | 132 |
| 0 | Games Started | 0 |
| 1 | Pinch At Bats | 1 |
| 1 | Pinch Hits | 0 |
| 0.0 | Player Rating | 0.0 |
| 1 | Is Qualified | 1 |
| 1 | Is Qualified In Steals | 1 |
| 14 | Total Bases | 10 |
| 36 | Plate Appearances | 36 |
| 162.0 | Projected Home Runs | 0.0 |
| 2 | Extra Base Hits | 2 |
| 4.5 | Runs Created | 2.5 |
| .294 | Batting Average | .242 |
| 1.000 | Pinch Hit Average | .000 |
| .412 | Slugging Percentage | .303 |
| .176 | Secondary Average | .091 |
| .333 | On Base Percentage | .306 |
| .745 | OBP Pct + SLG Pct | .609 |
| 1.7 | Ground To Fly Ball Ratio | 0.8 |
| 4.9 | Runs Created Per 27 Outs | 2.5 |
| 28.0 | Batter Rating | 20.0 |
| 34.0 | At Bats Per Home Run | 0.0 |
| 0.50 | Stolen Base Percentage | 0.00 |
| 4.61 | Pitches Per Plate Appearance | 3.67 |
| .118 | Isolated Power | .061 |
| 0.20 | Walk To Strikeout Ratio | 0.22 |
| .056 | Walks Per Plate Appearance | .056 |
| -.118 | Secondary Average Minus Batting Average | -.152 |
| 6.0 | Runs Produced | 4.0 |
| 1.0 | Runs Ratio | 1.0 |
| 0.5 | Patience Ratio | 0.4 |
| 0.4 | Balls In Play Average | 0.3 |
| 81.0 | MLB Rating | 73.0 |
| 0.0 | Offensive Wins Above Replacement | 0.0 |
| 0.0 | Wins Above Replacement | 0.0 |
Game Information
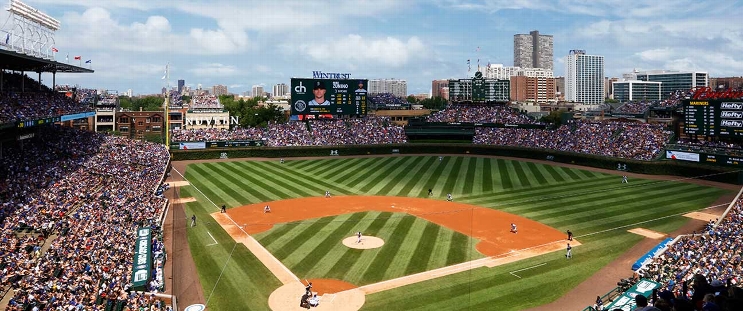
Location: Chicago, Illinois
Attendance: 36,635 | Capacity:
2026 National League East Standings
| TEAM | W | L | PCT | GB | STRK |
|---|---|---|---|---|---|
 Atlanta |
- | 68 | L1 | 0.5802469 | 94 |
 Philadelphia |
6 | 74 | W1 | 0.54320985 | 88 |
| Miami |
14 | 82 | W1 | 0.49382716 | 80 |
 Washington |
17 | 85 | W1 | 0.47530866 | 77 |
 New York |
20 | 88 | L1 | 0.45679012 | 74 |
2026 National League Central Standings
| TEAM | W | L | PCT | GB | STRK |
|---|---|---|---|---|---|
 Milwaukee |
- | 59 | W5 | 0.63580245 | 103 |
| Chicago |
14 | 73 | W1 | 0.5493827 | 89 |
 Pittsburgh |
21 | 80 | W1 | 0.50617284 | 82 |
 St. Louis |
26 | 85 | L4 | 0.47530866 | 77 |
 Cincinnati |
28 | 87 | L1 | 0.46296296 | 75 |