
Cincinnati Reds at Atlanta Braves
· Major League Baseball
7 - 6

Elly De La Cruz hits 30th homer and Reds rally for 7-6 win over Braves, who lock up NL's No. 3 seed

With the loss, Atlanta secured the No. 3 seed for the National League playoffs, behind Milwaukee and the Los Angeles Dodgers. The Braves (93-66) will host a best-of-three Wild Card Series starting Tuesday.
Rodríguez's two-run homer in the sixth inning off AJ Smith-Shawver (0-3) made it 7-6. De La Cruz extended his career high with a shot to right field in the third, and he needs one stolen base for the fourth 30/30 season in Reds history.
Jorge led off the game with his first career homer.
Connor Phillips (2-0), the third of six Cincinnati pitchers, got four outs. Emilio Pagán worked the ninth for his 25th save.
Atlanta scored four runs in the bottom of the first, but Cincinnati quickly rallied against Tyler Mahle. The right-hander gave up five runs in five innings in his final start before the playoffs. It was his worst outing since joining the Braves from San Francisco at the trade deadline. He gave up two runs or fewer in each of his previous eight starts with Atlanta.
Braves star Ronald Acuña Jr. returned after missing one game with a bone bruise on his shin, racing around at full speed to score from first on a double in the first inning. He was 2 for 5 with a stolen base.
Reds starter Brady Singer lasted three innings and gave up five runs on seven hits. Austin Riley homered against him in the third.
Braves: Have not announced a starter for Friday's series opener at Miami. RHP Eury Pérez (7-11, 4.14) starts for the Marlins.
See AP’s full MLB coverage here
How can I watch Cincinnati Reds vs. Atlanta Braves?
- TV Channel: Reds at Braves 2022 MLB Baseball, is broadcasted on MLB.TV.
- Online streaming: Sign up for Fubo.
Scoring Summary
 |
9th Inning | Yastrzemski flied out to center. |
|
9th Inning | Albies struck out swinging. |
|
9th Inning | Harris II to third on wild pitch by Pagán. |
|
9th Inning | Dubón hit sacrifice bunt to pitcher, Harris II to second. |
|
9th Inning | Harris II reached on infield single to second. |
 |
9th Inning | Pagán relieved Burke |
Statistics
 CIN |
 ATL |
|
|---|---|---|
| 1 | Games Played | 1 |
| 1 | Team Games Played | 1 |
| 1 | Hit By Pitch | 0 |
| 11 | Ground Balls | 12 |
| 7 | Strikeouts | 4 |
| 7 | Runs Batted In | 6 |
| 0 | Sacrifice Hit | 1 |
| 7 | Hits | 12 |
| 0 | Stolen Bases | 2 |
| 2 | Walks | 4 |
| 0 | Catcher Interference | 0 |
| 7 | Runs | 6 |
| 0 | Ground Into Double Play | 0 |
| 0 | Sacrifice Flies | 2 |
| 33 | At Bats | 36 |
| 3 | Home Runs | 1 |
| 0 | Grand Slam Home Runs | 0 |
| 5 | Runners Left On Base | 15 |
| 0 | Triples | 0 |
| 1 | Game Winning RBIs | 0 |
| 0 | Intentional Walks | 0 |
| 1 | Doubles | 2 |
| 15 | Fly Balls | 23 |
| 1 | Caught Stealing | 0 |
| 153 | Pitches | 148 |
| 0 | Games Started | 0 |
| 0 | Pinch At Bats | 0 |
| 0 | Pinch Hits | 0 |
| 0.0 | Player Rating | 0.0 |
| 1 | Is Qualified | 1 |
| 1 | Is Qualified In Steals | 1 |
| 17 | Total Bases | 17 |
| 36 | Plate Appearances | 43 |
| 486.0 | Projected Home Runs | 162.0 |
| 4 | Extra Base Hits | 3 |
| 4.6 | Runs Created | 7.4 |
| .212 | Batting Average | .333 |
| .000 | Pinch Hit Average | .000 |
| .515 | Slugging Percentage | .472 |
| .333 | Secondary Average | .306 |
| .278 | On Base Percentage | .381 |
| .793 | OBP Pct + SLG Pct | .853 |
| 0.7 | Ground To Fly Ball Ratio | 0.5 |
| 4.6 | Runs Created Per 27 Outs | 7.4 |
| 46.0 | Batter Rating | 45.0 |
| 11.0 | At Bats Per Home Run | 36.0 |
| 0.00 | Stolen Base Percentage | 1.00 |
| 4.25 | Pitches Per Plate Appearance | 3.44 |
| .303 | Isolated Power | .139 |
| 0.29 | Walk To Strikeout Ratio | 1.00 |
| .056 | Walks Per Plate Appearance | .093 |
| .121 | Secondary Average Minus Batting Average | -.028 |
| 14.0 | Runs Produced | 12.0 |
| 1.0 | Runs Ratio | 1.0 |
| 0.6 | Patience Ratio | 0.5 |
| 0.2 | Balls In Play Average | 0.4 |
| 89.3 | MLB Rating | 95.3 |
| 0.0 | Offensive Wins Above Replacement | 0.0 |
| 0.0 | Wins Above Replacement | 0.0 |
Game Information
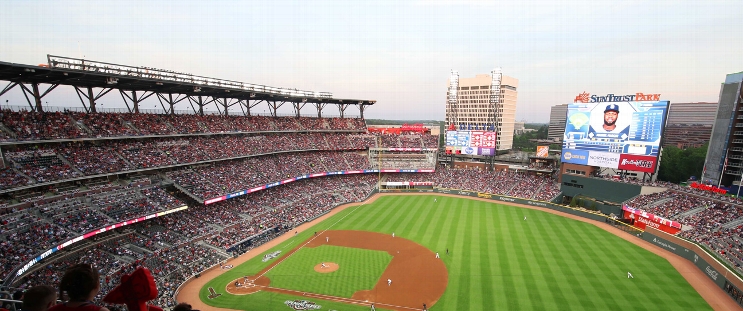
Location: Atlanta, Georgia
Attendance: 40,165 | Capacity:
2026 National League Central Standings
| TEAM | W | L | PCT | GB | STRK |
|---|---|---|---|---|---|
 Milwaukee |
- | 59 | W5 | 0.63580245 | 103 |
 Chicago |
14 | 73 | W1 | 0.5493827 | 89 |
 Pittsburgh |
21 | 80 | W1 | 0.50617284 | 82 |
 St. Louis |
26 | 85 | L4 | 0.47530866 | 77 |
| Cincinnati |
28 | 87 | L1 | 0.46296296 | 75 |
2026 National League East Standings
| TEAM | W | L | PCT | GB | STRK |
|---|---|---|---|---|---|
| Atlanta |
- | 68 | L1 | 0.5802469 | 94 |
 Philadelphia |
6 | 74 | W1 | 0.54320985 | 88 |
 Miami |
14 | 82 | W1 | 0.49382716 | 80 |
 Washington |
17 | 85 | W1 | 0.47530866 | 77 |
 New York |
20 | 88 | L1 | 0.45679012 | 74 |