
New York Mets at Washington Nationals
· Major League Baseball
6 - 7

High-spending Mets assured of first last-place finish since 2003 with 7-6 loss to Nationals

Dylan Crews homered for the Nationals (76-84), who have won nine of 12 and are guaranteed fourth in the NL East. They have been fourth or fifth for seven straight seasons since winning the 2019 World Series.
New York (73-87), which began the season with a major league record $358.4 million payroll, will finish last for the first time since it was 66-95 in 2002.
Bo Bichette and Carson Benge homered for the Mets. Benge became the first Mets rookie with 20 homers and 20 steals in a season.
Gray worked around Juan Soto’s two-out walk in the ninth, getting Bichette to hit a soft grounder to the mound to cap his first outing at Nationals Park since April 4, 2024. An All-Star in 2023, Gray underwent Tommy John surgery the following year and did not return to the major leagues until last week.
Gus Varland (2-2) pitched 1 1/3 scoreless innings. Jonathan Pintaro (2-3) was the loser.
See AP’s full MLB coverage here
How can I watch New York Mets vs. Washington Nationals?
- TV Channel: Mets at Nationals 2022 MLB Baseball, is broadcasted on MLB.TV.
- Online streaming: Sign up for Fubo.
Scoring Summary
 |
9th Inning | Bichette grounded out to pitcher. |
|
9th Inning | Soto walked. |
|
9th Inning | Lindor struck out swinging. |
|
9th Inning | Morel flied out to shortstop. |
 |
9th Inning | Gray relieved Sinclair |
|
9th Inning | Nuñez at shortstop. |
Statistics
 NYM |
 WSH |
|
|---|---|---|
| 1 | Games Played | 1 |
| 1 | Team Games Played | 1 |
| 0 | Hit By Pitch | 0 |
| 12 | Ground Balls | 12 |
| 12 | Strikeouts | 4 |
| 6 | Runs Batted In | 5 |
| 0 | Sacrifice Hit | 0 |
| 9 | Hits | 11 |
| 0 | Stolen Bases | 2 |
| 4 | Walks | 5 |
| 0 | Catcher Interference | 0 |
| 6 | Runs | 7 |
| 1 | Ground Into Double Play | 1 |
| 2 | Sacrifice Flies | 1 |
| 33 | At Bats | 32 |
| 2 | Home Runs | 1 |
| 0 | Grand Slam Home Runs | 0 |
| 10 | Runners Left On Base | 16 |
| 0 | Triples | 0 |
| 0 | Game Winning RBIs | 0 |
| 0 | Intentional Walks | 0 |
| 2 | Doubles | 1 |
| 11 | Fly Balls | 17 |
| 0 | Caught Stealing | 1 |
| 158 | Pitches | 160 |
| 0 | Games Started | 0 |
| 1 | Pinch At Bats | 2 |
| 1 | Pinch Hits | 0 |
| 0.0 | Player Rating | 0.0 |
| 1 | Is Qualified | 1 |
| 0 | Is Qualified In Steals | 1 |
| 17 | Total Bases | 15 |
| 39 | Plate Appearances | 38 |
| 324.0 | Projected Home Runs | 162.0 |
| 4 | Extra Base Hits | 2 |
| 5.7 | Runs Created | 6.4 |
| .273 | Batting Average | .344 |
| 1.000 | Pinch Hit Average | .000 |
| .515 | Slugging Percentage | .469 |
| .364 | Secondary Average | .313 |
| .333 | On Base Percentage | .421 |
| .848 | OBP Pct + SLG Pct | .890 |
| 1.1 | Ground To Fly Ball Ratio | 0.7 |
| 5.7 | Runs Created Per 27 Outs | 7.2 |
| 43.0 | Batter Rating | 42.0 |
| 16.5 | At Bats Per Home Run | 32.0 |
| 0.00 | Stolen Base Percentage | 0.67 |
| 4.05 | Pitches Per Plate Appearance | 4.21 |
| .242 | Isolated Power | .125 |
| 0.33 | Walk To Strikeout Ratio | 1.25 |
| .103 | Walks Per Plate Appearance | .132 |
| .091 | Secondary Average Minus Batting Average | -.031 |
| 12.0 | Runs Produced | 12.0 |
| 1.0 | Runs Ratio | 0.7 |
| 0.6 | Patience Ratio | 0.5 |
| 0.4 | Balls In Play Average | 0.4 |
| 89.5 | MLB Rating | 92.5 |
| 0.0 | Offensive Wins Above Replacement | 0.0 |
| 0.0 | Wins Above Replacement | 0.0 |
Game Information
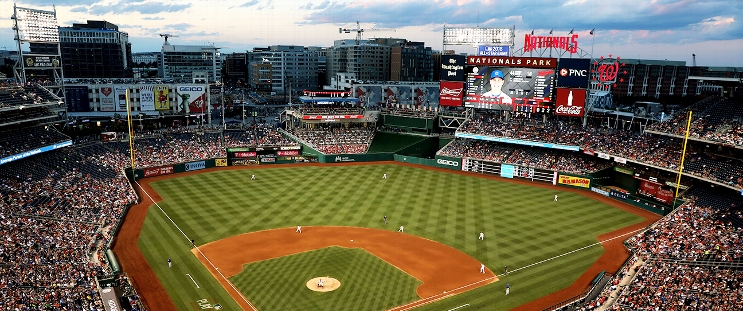
Location: Washington, District of Columbia
Attendance: 28,639 | Capacity:
2026 National League East Standings
| TEAM | W | L | PCT | GB | STRK |
|---|---|---|---|---|---|
 Atlanta |
- | 68 | L1 | 0.5802469 | 94 |
 Philadelphia |
6 | 74 | W1 | 0.54320985 | 88 |
 Miami |
14 | 82 | W1 | 0.49382716 | 80 |
| Washington |
17 | 85 | W1 | 0.47530866 | 77 |
| New York |
20 | 88 | L1 | 0.45679012 | 74 |