
Texas Rangers at Minnesota Twins
· Major League Baseball
2 - 10

Rangers falter in AL West chase, lose to Twins 10-2 as deGrom matches high by allowing 8 earned runs

Texas (79-81) remains tied with Houston, which has the tiebreaker. The Astros lost 6-5 at the Athletics, and the division winner will be baseball's first postseason team without a winning record in a full season. An Astros win and Rangers loss on Saturday would clinch the division for Houston.
Given a 2-0 lead, deGrom (11-11) gave up six runs in the second inning and two more in the fourth. He allowed eight hits and three walks while striking out five over four innings. It's the fourth time deGrom has allowed eight earned runs in a game.
Luke Keaschall had four hits, including a double and a triple, and drove in three runs for the Twins. Kody Clemens went 3 for 4 and hit his team-leading 27th homer of the season in the sixth inning.
Twins starter Joe Ryan (7-10) allowed two runs and four hits with eight strikeouts over six innings.
Corey Seager hit an RBI single and Wyatt Langford a run-scoring grounder as Rangers took advantage of two hit batters in the first inning.
Royce Lewis hit a tying, two-run single in the second inning, and Ryan Kreidler brought home the go-ahead run with a safety squeeze bunt that turned into a single when nobody covered first base. Keaschall tripled in two more runs before scoring on a deGrom wild pitch.
Texas designated hitter Josh Jung suffered a broken bone in his right hand when he was hit by a pitch in the first inning. He stayed in the game and scored the Rangers' second run, then was replaced by a pinch hitter in the third inning.
See AP's full MLB coverage here
How can I watch Texas Rangers vs. Minnesota Twins?
- TV Channel: Rangers at Twins 2022 MLB Baseball, is broadcasted on MLB.TV.
- Online streaming: Sign up for Fubo.
Scoring Summary
 |
9th Inning | Jansen flied out to center. |
|
9th Inning | Freeman grounded into double play, third to second to first, Burger out at second. Minnesota Twins challenged: call on the field was overturned. |
|
9th Inning | Freeman hit for Carter |
|
9th Inning | Burger singled to center. |
 |
9th Inning | Rogers relieved Nance |
|
9th Inning | Sabato at first base. |
Statistics
 TEX |
 MIN |
|
|---|---|---|
| 1 | Games Played | 1 |
| 1 | Team Games Played | 1 |
| 3 | Hit By Pitch | 0 |
| 11 | Ground Balls | 8 |
| 10 | Strikeouts | 9 |
| 2 | Runs Batted In | 9 |
| 0 | Sacrifice Hit | 0 |
| 6 | Hits | 11 |
| 0 | Stolen Bases | 2 |
| 2 | Walks | 3 |
| 0 | Catcher Interference | 0 |
| 2 | Runs | 10 |
| 2 | Ground Into Double Play | 0 |
| 0 | Sacrifice Flies | 0 |
| 31 | At Bats | 35 |
| 0 | Home Runs | 1 |
| 0 | Grand Slam Home Runs | 0 |
| 13 | Runners Left On Base | 8 |
| 0 | Triples | 1 |
| 0 | Game Winning RBIs | 1 |
| 0 | Intentional Walks | 0 |
| 1 | Doubles | 1 |
| 10 | Fly Balls | 18 |
| 0 | Caught Stealing | 0 |
| 141 | Pitches | 151 |
| 0 | Games Started | 0 |
| 3 | Pinch At Bats | 1 |
| 1 | Pinch Hits | 0 |
| 0.0 | Player Rating | 0.0 |
| 1 | Is Qualified | 1 |
| 0 | Is Qualified In Steals | 1 |
| 7 | Total Bases | 17 |
| 36 | Plate Appearances | 38 |
| 0.0 | Projected Home Runs | 162.0 |
| 1 | Extra Base Hits | 3 |
| 1.8 | Runs Created | 6.6 |
| .194 | Batting Average | .314 |
| .333 | Pinch Hit Average | .000 |
| .226 | Slugging Percentage | .486 |
| .097 | Secondary Average | .314 |
| .306 | On Base Percentage | .368 |
| .531 | OBP Pct + SLG Pct | .854 |
| 1.1 | Ground To Fly Ball Ratio | 0.4 |
| 1.8 | Runs Created Per 27 Outs | 7.5 |
| 16.0 | Batter Rating | 58.5 |
| 0.0 | At Bats Per Home Run | 35.0 |
| 0.00 | Stolen Base Percentage | 1.00 |
| 3.92 | Pitches Per Plate Appearance | 3.97 |
| .032 | Isolated Power | .171 |
| 0.20 | Walk To Strikeout Ratio | 0.33 |
| .056 | Walks Per Plate Appearance | .079 |
| -.097 | Secondary Average Minus Batting Average | .000 |
| 4.0 | Runs Produced | 19.0 |
| 1.0 | Runs Ratio | 0.9 |
| 0.3 | Patience Ratio | 0.5 |
| 0.3 | Balls In Play Average | 0.4 |
| 68.5 | MLB Rating | 99.0 |
| 0.0 | Offensive Wins Above Replacement | 0.0 |
| 0.0 | Wins Above Replacement | 0.0 |
Game Information
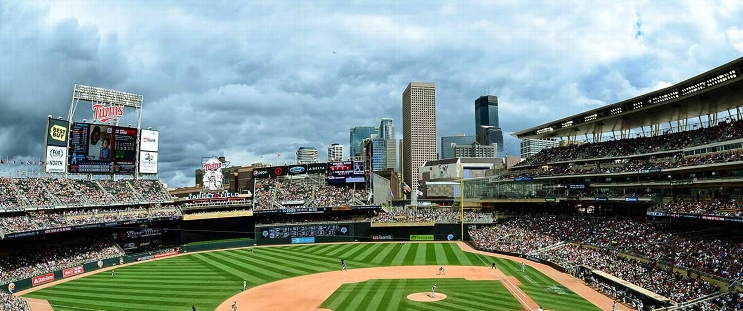
Location: Minneapolis, Minnesota
Attendance: 25,768 | Capacity:
2026 American League West Standings
| TEAM | W | L | PCT | GB | STRK |
|---|---|---|---|---|---|
 Houston |
- | 81 | W2 | 0.5 | 81 |
| Texas |
1 | 82 | L1 | 0.49382716 | 80 |
 Seattle |
5 | 86 | W2 | 0.4691358 | 76 |
 Athletics |
17 | 98 | L2 | 0.39506173 | 64 |
 Los Angeles |
19 | 100 | L2 | 0.38271606 | 62 |
2026 American League Central Standings
| TEAM | W | L | PCT | GB | STRK |
|---|---|---|---|---|---|
 Cleveland |
- | 77 | L1 | 0.52469134 | 85 |
 Chicago |
1 | 78 | W1 | 0.5185185 | 84 |
| Minnesota |
8 | 85 | W1 | 0.47530866 | 77 |
 Detroit |
9 | 86 | L1 | 0.4691358 | 76 |
 Kansas City |
16 | 93 | W1 | 0.42592594 | 69 |