
Cincinnati Reds at Toronto Blue Jays
· Major League Baseball
5 - 1

Bleday hits 24th homer, Lowder pitches 6 innings for first win since August as Reds beat Blue Jays

Rhett Lowder (7-12) allowed three hits in six scoreless innings to win for the first time since August 28, stopping a four-start losing streak.
Cincinnati improved to 29-18 against AL opponents. The Reds were 46-68 vs. the NL.
Toronto's Vladimir Guerrero Jr. went 0 for 4 with two strikeouts and was booed by some in the sellout crowd of 42,482. Guerrero, who has slumped this season while playing with injuries, apologized Friday for comments that this $500 million, 14-year contract was for past accomplishments.
Blue Jays right-hander Trey Yesavage (5-6) allowed one run and two hits in two innings. The 23-year-old rookie right-hander returned last Monday after missing 42 games because of left knee surgery and finished with a 3.69 ERA in 20 starts, striking out 97 in 97 2/3 innings.
Bleday led off the second inning with his 24th home run, a 413-foot drive to center.
Cincinnati boosted the lead to 3-0 the third against Spencer Miles on shortstop Andrés Giménez's fielding error and Eugenio Suárez's RBI double. Rodríguez tripled with two outs in the fifth off John Klein.
Giménez hit a run-scoring groundout in the seventh against Connor Phillips.
----
See AP’s full MLB coverage here
How can I watch Cincinnati Reds vs. Toronto Blue Jays?
- TV Channel: Reds at Blue Jays 2022 MLB Baseball, is broadcasted on MLB.TV.
- Online streaming: Sign up for Fubo.
Scoring Summary
 |
9th Inning | Smith lined out to left. |
|
9th Inning | Keys popped out to shortstop. |
|
9th Inning | Okamoto struck out swinging. |
 |
9th Inning | Antone relieved Ashcraft |
|
9th Inning | Stewart grounded out to shortstop. |
|
9th Inning | De La Cruz grounded out to second. |
Statistics
 CIN |
 TOR |
|
|---|---|---|
| 1 | Games Played | 1 |
| 1 | Team Games Played | 1 |
| 0 | Hit By Pitch | 0 |
| 0 | Ground Balls | 0 |
| 12 | Strikeouts | 5 |
| 5 | Runs Batted In | 1 |
| 0 | Sacrifice Hit | 0 |
| 6 | Hits | 5 |
| 2 | Stolen Bases | 0 |
| 6 | Walks | 3 |
| 0 | Catcher Interference | 0 |
| 5 | Runs | 1 |
| 0 | Ground Into Double Play | 1 |
| 0 | Sacrifice Flies | 0 |
| 33 | At Bats | 31 |
| 1 | Home Runs | 0 |
| 0 | Grand Slam Home Runs | 0 |
| 17 | Runners Left On Base | 16 |
| 1 | Triples | 0 |
| 0 | Game Winning RBIs | 0 |
| 0 | Intentional Walks | 0 |
| 1 | Doubles | 2 |
| 0 | Fly Balls | 0 |
| 2 | Caught Stealing | 0 |
| 150 | Pitches | 121 |
| 0 | Games Started | 0 |
| 0 | Pinch At Bats | 0 |
| 0 | Pinch Hits | 0 |
| 0.0 | Player Rating | 0.0 |
| 1 | Is Qualified | 1 |
| 1 | Is Qualified In Steals | 0 |
| 12 | Total Bases | 7 |
| 39 | Plate Appearances | 34 |
| 162.0 | Projected Home Runs | 0.0 |
| 3 | Extra Base Hits | 2 |
| 3.7 | Runs Created | 1.1 |
| .182 | Batting Average | .161 |
| .000 | Pinch Hit Average | .000 |
| .364 | Slugging Percentage | .226 |
| .364 | Secondary Average | .161 |
| .308 | On Base Percentage | .235 |
| .671 | OBP Pct + SLG Pct | .461 |
| 0.0 | Ground To Fly Ball Ratio | 0.0 |
| 3.5 | Runs Created Per 27 Outs | 1.1 |
| 35.5 | Batter Rating | 13.0 |
| 33.0 | At Bats Per Home Run | 0.0 |
| 0.50 | Stolen Base Percentage | 0.00 |
| 3.85 | Pitches Per Plate Appearance | 3.56 |
| .182 | Isolated Power | .065 |
| 0.50 | Walk To Strikeout Ratio | 0.60 |
| .154 | Walks Per Plate Appearance | .088 |
| .182 | Secondary Average Minus Batting Average | .000 |
| 10.0 | Runs Produced | 2.0 |
| 1.0 | Runs Ratio | 1.0 |
| 0.5 | Patience Ratio | 0.3 |
| 0.3 | Balls In Play Average | 0.2 |
| 78.8 | MLB Rating | 66.0 |
| 0.0 | Offensive Wins Above Replacement | 0.0 |
| 0.0 | Wins Above Replacement | 0.0 |
Game Information
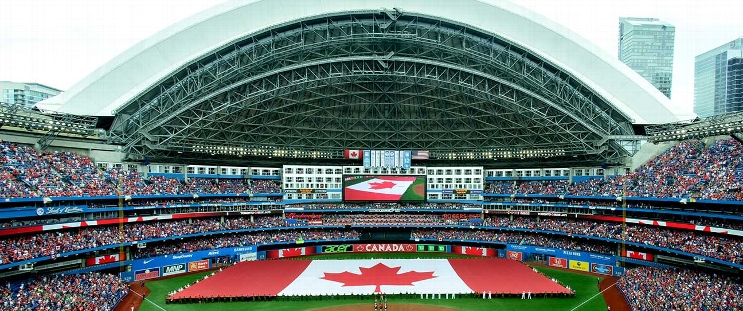
Location: Toronto, Ontario
Attendance: 42,482 | Capacity:
2026 National League Central Standings
| TEAM | W | L | PCT | GB | STRK |
|---|---|---|---|---|---|
 Milwaukee |
- | 59 | W5 | 0.63580245 | 103 |
 Chicago |
14 | 73 | W1 | 0.5493827 | 89 |
 Pittsburgh |
21 | 80 | W1 | 0.50617284 | 82 |
 St. Louis |
26 | 85 | L4 | 0.47530866 | 77 |
| Cincinnati |
28 | 87 | L1 | 0.46296296 | 75 |
2026 American League East Standings
| TEAM | W | L | PCT | GB | STRK |
|---|---|---|---|---|---|
 Tampa Bay |
- | 64 | L1 | 0.60493827 | 98 |
 New York |
4.5 | 68 | W1 | 0.57763976 | 93 |
 Boston |
11 | 75 | L1 | 0.537037 | 87 |
 Baltimore |
18.5 | 82 | L1 | 0.49068323 | 79 |
| Toronto |
19 | 83 | W1 | 0.48765433 | 79 |