
Buffalo Sabres at Tampa Bay Lightning
· National Hockey League

Regular Season Series
Series starts 11/11
Statistics
 BUF |
 TB |
|
|---|---|---|
| 3.67 | Goals Against Average | 2.63 |
| 25.7 | Shots Against per Game | 23.0 |
| 64.5 | Penalty Kill Percentage | 75.0 |
| 11 | Power Play Goals Against | 5 |
| 0 | Short Handed Goals Against | 0 |
| 3.00 | Goals For per Game | 3.13 |
| 26.7 | Shots per Game | 30.9 |
| 3 | Power Play Goals | 3 |
| 9.1 | Power Play Percentage | 10.7 |
| 1 | Short Handed Goals | 0 |
| 81 | Penalty Minutes | 68 |
 Tampa Bay Lightning Injuries
| NAME, POS | STATUS | DATE |
|---|---|---|
| Yanni Gourde, C | Injured Reserve | Sep 28 |
 Buffalo Sabres Injuries
| NAME, POS | STATUS | DATE |
|---|---|---|
| Rasmus Dahlin, D | Day-To-Day | Oct 18 |
| Alex Lyon, G | Injured Reserve | Oct 15 |
| Matt Grzelcyk, D | Injured Reserve | Oct 13 |
| Jason Zucker, LW | Injured Reserve | Oct 6 |
| Conor Timmins, D | Injured Reserve | Sep 29 |
Game Information
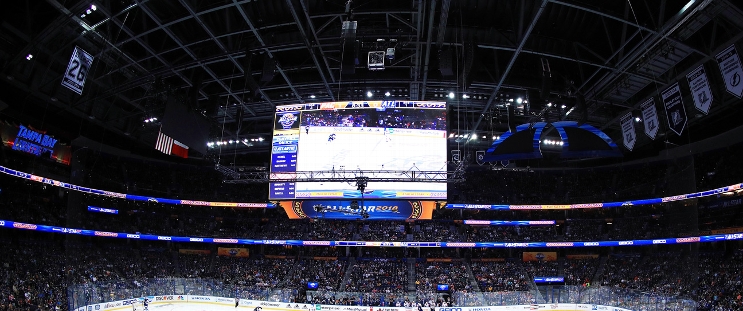 Benchmark International Arena
Location: Tampa, FL
Capacity:
Benchmark International Arena
Location: Tampa, FL
Capacity:
Full Standings








 UTA
 MIN
 NYI
 NYR
 SEA
 VAN